 My name is Isaiah Lyons-Galante. I am a second-year masters student in Geography. Since the start of my program, I have been working as a Graduate Research Assistant at the National Renewable Energy Laboratory (NREL) on data visualization research with my advisor, Morteza Karimzadeh. I am tackling a challenge in geovisualization -- how can we accurately visualize electricity grid networks at multiple scales? How can we show the health of a grid that has 20,000+ nodes? How can we help energy grid planners and operators see both geographical and topological patterns to diagnose problems?
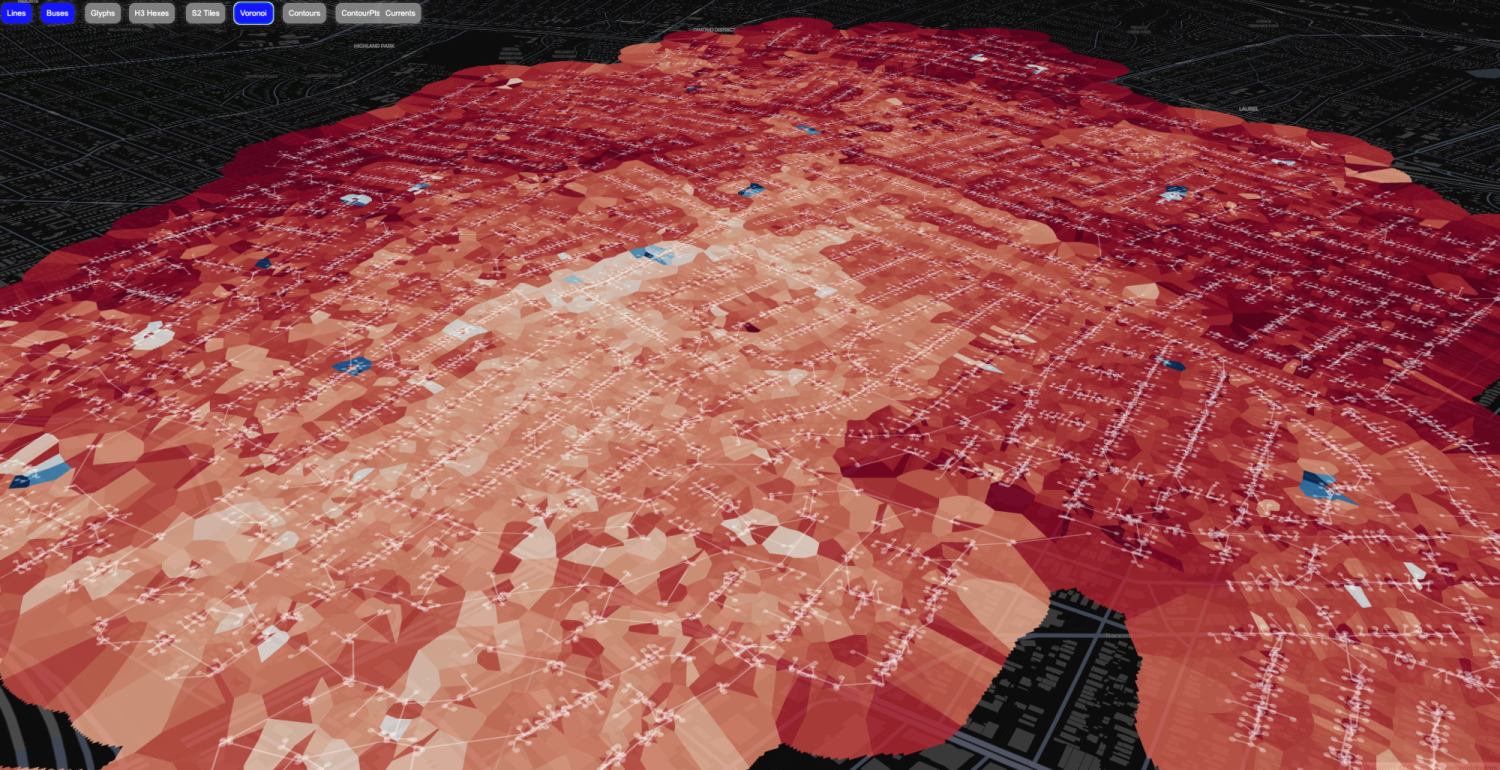
 To address these questions, we developed 4 novel visualization systems for power systems data and compared them to each other and current practices. We found that tessellations worked well at depicting the grid when they gave visual real estate to every node in the network. We also developed a new algorithm for creating a contour map that considered the topology of the network when interpolating values. We published our work at the annual IEEE Vis conference in Melbourne, Australia in the Energy Vis Workshop. I am now working on embedding our visualizations into a web app that can be used by grid planners at NREL, which you can check out on my lab's GitHub page as it evolves.
What I appreciate most about the work experience is the way that my mentors at NREL, Kenny Gruchalla and Kristi Potter, treat me like a full member of their team. We have weekly team check-ins, I sit side-by-side with my colleagues twice per week, and I have access to the state-of-the-art visualization spaces, both 2D and 3D. I have even had a chance to travel with them to two data visualization conferences in the last year, in Idaho and in Oklahoma. It is a privilege to work with them and other NRELians on problems at the heart of the sustainable energy transition going on in the U.S. right now.