Effects of Adolescent Caffeine Consumption on Anxiety and Stress in Adulthood, Talia Scott
Abstract
Caffeine is the most widely used psychoactive substance in the world. Although adolescents are the most rapidly increasing group of caffeine consumers, few studies have been done on the effects of caffeine on the still-developing adolescent brain. Since caffeine has been associated with stress reactivity and anxious behavior, this study examined the effect of adolescent caffeine consumption on these measures in adulthood using a rat model. Male Sprague Dawley rats were exposed to caffeine (0.3 g/L) for the duration of their adolescence (postnatal days 28-56). Once they were adults and had withdrawn from caffeine for a week (after postnatal day 60), they were exposed to either an elevated plus maze to measure anxiety behavior or underwent a pedestal stress test. From the pedestal stress test, in situ hybridization was used to measure c-fos mRNA in the basolateral amygdala (BLA), paraventricular nucleus (PVN), and bed nucleus of the stria terminalis (BST), and immunoassays were performed to determine corticosterone (CORT) levels in the blood plasma. Animals that consumed caffeine in their adolescence spent significantly less time in the open arms of the elevated plus maze in adulthood, indicating heightened anxiety. Accordingly, animals that consumed caffeine in their adolescence had heightened BLA activity in response to the pedestal stress. As adults these animals also displayed higher basal CORT levels and blunted CORT levels in response to a stressor, implying a dysregulation of their stress response system. PVN activity was higher basally, potentially explaining the rise in basal CORT release. The BST activity had no significant results. Although it is unclear how caffeine causes these changes in rat behavior, neuronal activity, and neuroendocrine measures, it is apparent that the consumption of caffeine in adolescence can have persistent unwanted effects on anxiety behavior and stress reactivity in adulthood.
Introduction
Caffeine is consumed by a large number of people. In the United States, the average amount of caffeine consumed is 168 mg/person/day (Fredholm, Bättig, Holmén, Nehlig, & Zvartau, 1999), and the number of caffeine consumers has been steadily increasing (Frary, Johnson, & Wang, 2005). Interestingly, the number of caffeine consumers who are adolescents has been increasing the fastest. Over the past 30 years the number of adolescent caffeine consumers has grown 70% (Harnack, Stang, & Story, 1999). The adolescent brain is still undergoing biological growth and change, and it is unclear how caffeine may impact the brain during this developmental period. Surprisingly few studies have examined the effects of caffeine in the adolescent brain. The studies in this thesis are designed to assess the effects of adolescent caffeine consumption on subsequent behavioral, neuroendocrine, and brain responses to stress and anxiety.
In adolescence, the brain is still actively developing. The adolescent stage of development is conserved across species (Spear, 2004). The limbic system controls motivation and emotion and matures earlier in adolescence (Gladwin, Figner, Crone, & Wiers, 2011). Additionally, the prefrontal cortex that mediates decision-making is not yet fully developed during this time (Steinberg, 2005). This leads to a sensitive period in brain development where emotional systems are strong but lack the capacity to be fully modulated by critical thinking coming from the prefrontal cortex. While brain systems are still being formed in adolescence, changes in receptor density or neuronal firing produced by caffeine could have long-lasting effects on the functioning of these systems.
Caffeine is a nonselective adenosine receptor antagonist, meaning it blocks the actions of adenosine on neurons. Adenosine is a neurotransmitter that is widely expressed throughout the brain, and it interacts with two main classes of adenosine receptors – A1 (inhibitory) and A2A (excitatory). These two classes are expressed in different brain regions. A1 receptors present throughout the brain but are most highly expressed in the hippocampus and the cortex (Fredholm et al., 1999). A2A receptors are highly expressed in the nucleus accumbens and striatum (Rosin, Robeva, Woodard, Guyenet, & Linden, 1998). Adenosine has various modulatory effects in the brain, especially on the release of other neurotransmitters. Typically, adenosine causes neural inhibition. So, when an antagonist such as caffeine is applied, the inhibition is stopped and brain activity increases (Fredholm et al., 1999). This process is fundamentally what makes caffeine a stimulant.
Caffeine has a multitude of behavioral and physiological effects in both the body and the brain. Caffeine can cause a rise in systolic blood pressure (Daniels, Molé, Shaffrath, & Stebbins, 1998) and locomotor activity (Holtzman, 1983). Caffeine can also increase learning ability and memory consolidation and retention (Temple, 2009). While there are not many health risks associated with caffeine as it is normally consumed, extremely high doses can have deleterious effects, and persistent caffeine use has the ability to cause dependence and withdrawal (Fredholm et al., 1999).
If caffeine can cause dependence, it likely has long-term effects on the brain. Chronic caffeine exposure increases c-fos expression in various brain regions, such as the nucleus accumbens and the hippocampus (Nakajima, Daval, Morgan, Post, & Marangos, 1989; Svenningsson, Johansson, & Fredholm, 1996). C-fos is an immediate early gene that is expressed very rapidly in neurons in response to an environmental experience and is thus used as an experimental tool to identify neurons within brain regions that had increased activity to a given experience. C-fos expression leads to significant biological changes in neurons. The c-fos mRNA encodes the Fos protein that dimerizes with the Jun protein to form the AP-1 complex (Chiu et al., 1988). The AP-1 complex serves as a transcription factor that can then increase the transcription of other proteins that are needed in response to an environmental experience, such as proteins involved in cell proliferation, neuroregeneration, or neurodegeneration (Wagner, 2001). Therefore, caffeine-induced c-fos expression indicates that caffeine has activated neurons and is causing neurons to undergo adaptive changes (Svenningsson et al., 1996). Additionally, caffeine affects receptor expression. For example, studies have shown that caffeine can increase adenosine A1 receptors, decrease β-adrenergic receptors, and promote intracellular Ca2+ release (Daly, 2007; Hawkins, Dugich, Porter, Urbancic, & Radulovacki, 1988; Jacobson, von Lubitz, Daly, & Fredholm, 1996). However, the studies are not clear whether these changes occur in adolescent animals as they were only observed in adult animals. If they were to occur in adolescence, caffeine could likely affect the development and functioning of certain brain structures.
Caffeine consumption has been associated with anxiety, especially when consumed at high doses. For example, caffeine can trigger panic attacks in patients with anxiety disorders (Uhde, Boulenger, Jimerson, & Post, 1984). Caffeine can also increase corticosterone (CORT) levels in rats (Patz, Day, Burow, & Campeau, 2006). Corticosterone is equivalent to the molecule cortisol in humans, which is released in response to stress (Dickerson & Kemeny, 2004). CORT is released by the adrenal gland but results from the activation of the hypothalamic-pituitary-adrenal (HPA) axis.
The HPA axis is a stress response system that allows the brain to coordinate a neuroendocrine response in preparation for fight or flight. There are multiple structures that provide input to activate the HPA axis by stimulating the paraventricular nucleus of the hypothalamus (PVN). The hippocampus stimulates the PVN with glutamate. The bed nucleus of the stria terminalis (BST) activates the PVN with either glutamate or corticotrophin-releasing hormone (CRH). The amygdala also activates the PVN and provides a strong link between brain structures regulating anxiety behavior (amygdala) and the structure regulating stress response (hypothalamus). The PVN releases CRH, which subsequently activates the anterior pituitary. The anterior pituitary releases adrenocorticotropic hormone (ACTH) that causes the adrenal cortex to release glucocorticoids (e.g., CORT) (Tsigos & Chrousos, 2002). Interestingly, if rats are exposed periodically to a stressor throughout their adolescence, they exhibit blunted hormonal responses to stress in adulthood (Goliszek et al., 1996). This physiological phenomenon indicates that during adolescence, animals are particularly sensitive to the effects of stress.
We conducted a series of experiments to address whether chronic caffeine administration throughout adolescence alters anxiety behavior, the neuroendocrine stress response, and brain activation patterns in adulthood. Anxiety-like behavior was determined by measuring the exploration of an anxiety-provoking, elevated plus maze. Additional experiments exposed animals to an elevated pedestal stress challenge. Then, an enzyme-linked immunosorbent assay (ELISA) was used to determine the levels of CORT present in blood plasma. Finally, brain slices were processed for c-fos mRNA expression in various brain regions using in situ hybridization. The hypothesis is that chronic caffeine consumption throughout adolescence will increase anxiety behavior, the neuroendocrine stress response, and brain activation in response to a stressor in adulthood.
Methods
Animals
Male Sprague Dawley rats (Charles River) were housed two to a cage with food and water available ad libitum. All experiments took place during the light period of a 12-hour light/dark cycle. All procedures were conducted in accordance with the guidelines established by the Institutional Animal Care and Use Committee at the University of Colorado Boulder.
Caffeine Consumption

Figure 1: Rats arrived on postnatal day 21, the first day they could be weaned from their mothers. After a 7-day adjustment period, the rats were exposed to a single bottle containing caffeine (0.3 g/L). They consumed caffeine for a 28-day period. The caffeine-containing bottle was replaced with water on postnatal 56. After an additional 7 days without caffeine, they were subjected to a pedestal stress test.
The rats arrived at 21 days after birth and had a 7-day adjustment period. Starting on postnatal day 28 (P28), half of the rats had access to a single bottle filled with caffeinated water (0.3 g/L), and the other half had a single bottle filled with non-caffeinated water. Twice a week (every 3 or 4 days), all bottles were weighed to determine how much liquid was consumed. On the days the bottles were weighed, the body weight of each rat was also recorded. After 28 days of caffeine acquisition (P56), the animals had a week off of caffeine. By P60, the rats are considered adults.
Elevated Plus Maze
Eight rats (4 water, 4 caffeine) were subjected to the elevated plus maze between P62-66. The elevated plus maze consisted of four arms (50 x 10 cm each) joined by a central platform (10 x 10 cm). Two arms were enclosed with 40 cm high walls with open ends, while the other two were “open”. The entire apparatus was elevated 75 cm from the floor. The elevated plus maze procedures were conducted in a fully lit room. Rats were put in the center of the maze and allowed to explore the arms for 5 minutes. A stopwatch was used to record the amount of time spent in the open arms. Being in an open arm was defined as more than half of the rat’s body being in the open arm.
Pedestal Stress Challenge
A separate set of 30 animals was used for the pedestal stress experiment. There were 15 rats exposed to caffeine and 15 exposed to water. In each group, 9 rats underwent pedestal stress, and the other 6 served as handled, home-cage controls. Thus, a total of 18 rats underwent the pedestal stress. The pedestal stress test occurred during the trough of the circadian corticosterone cycling. Rats were placed on a pedestal 60 cm elevated off the floor for 5 minutes. The pedestal was 27 cm2 and had no protective borders aside from a small 1 x 1 cm rim around the square to keep the rats from falling off. Exposure to the pedestal is thought to represent a psychological stress that is sufficient to induce physiological indications of stress (Pace et al., 2005).
After the pedestal stress, rats were returned to their home cages. Thirty minutes after the pedestal stress began, the rats were euthanized. Brain samples were immediately collected and flash frozen in a beaker of isopentane and dry ice for 30 seconds. They were then stored at -80°C. Trunk blood was collected in EDTA-coated tubes which were centrifuged at 2000 rpm for 10 min at 4°C. Then, blood plasma was pipetted into .5 mL microcentrifuge tubes and stored at -80°C (Babb, Masini, Day, & Campeau, 2014).
Corticosterone Immunoassay
CORT levels in the blood plasma were analyzed using a commercially available kit (Cat. # 901-097; Arbor Assay, Ann Arbor, MI). The directions on the kit were followed. The plasma samples and CORT standards were incubated together in the provided 96-well plate. After incubating, unbound reagents were washed from the plates and a substrate added. An hour later, the color intensity in each well was analyzed using a microplate reader, and the CORT concentration for each sample analyzed against a standard curve (Babb et al., 2014).
In-situ Hybridization
The regions of interest included the paraventricular nucleus (PVN), the basolateral amygdala (BLA), and the bed nucleus of the stria terminalis (BST). Each region was sliced into 12 μm slices on a cryostat. Slices were then mounted onto polylysine-coated slides and stored at -80°C. A radiolabeled riboprobe against c-Fos mRNA was generated by adding DNA, RNA polymerase, NTPs (ATP, GTP, CTP), and [35S]-UTP to a buffer solution. Slides were fixed in 4% paraformaldehyde, acetylated in triethanolamine and acetic anhydride, and dehydrated through graded alcohol. The slides were plated with the riboprobe mixed with hybridization buffer and incubated overnight at 55°C.
The next day, slides were washed with RNase and rinsed in grades of standard saline citrate (SSC). The slides were incubated in a .1x SSC at 70°C for 1.5 hours, cooled, and again dehydrated through graded alcohol. After drying, the slides were put into cassettes and exposed to x-ray film. The BST region was developed after 15 days, while the PVN and BLA regions were developed after 13 days (Day & Akil, 1996; Day, Nebel, Sasse, & Campeau, 2005).
Image AnalysisSlide films were photographed and analyzed using Scion Image. A template was placed over the region of interest, and the signal and area values were recorded (PVN used a 50x45 rectangle in the center, BST a 80x40 rectangle on either side, and the BLA a 50x50 circle on either side). The signal and area were multiplied, giving the integrated density value, the value used for statistical analysis.
Data Analysis
Total fluid consumption (ml/day) and body weights (g) were analyzed using a mixed design two-way ANOVA with treatment (water vs. caffeine) as a between subjects factor and days as a within subject factor. The amount of caffeine consumed (mg/kg/day) was analyzed using a one-way repeated-measure ANOVA across days. The effect of caffeine on percent time spent in the open arms was analyzed by an unpaired t-test. Integrated density was analyzed by a two-way ANOVA with treatment (water vs. caffeine) and stress (home cage vs. pedestal) as the factors. For the CORT assay, corticosterone (pg/dl) in the blood plasma was analyzed by a two-way ANOVA with treatment (water vs. caffeine) and stress (home cage vs. pedestal) as the factors. Significant interactions were followed by a priori and post hoc tests (unpaired t-test or Bonferroni’s comparisons). Statistical significance for all tests was set at p < 0.05.
Results
Caffeine Consumption
Throughout the caffeine drinking procedure (Figure 2), caffeine consumption (mg/kg/day), the volume of fluid consumed per day (ml/day), and body weights (g) were recorded. There were no significant group differences in the weights of the rats over the course of the caffeine consumption procedure. However, both groups gained significant amounts of weight over the course of the procedure (F(7, 210) = 1307, p < 0.0001). Together, these results indicated that caffeine consumption during adolescence did not adversely affect basic development processes (Figure 2A). However, the amount of caffeinated water ingested by the caffeine rats was consistently lower than the amount of normal water ingested by the control rats (F(1, 126) = 5.183, p = 0.0352). Thus, although they drank less, their weights imply that this had no adverse effect on their health. Total fluid consumption increased significantly for both groups over time (F(7, 126) = 93.32, p < 0.0001) (Figure 2B). Caffeine consumption per the rats’ body weights decreased over time, even though the fluid consumption increased (F(7, 105) = 32.08, p < 0.0001). This finding could be because the rats’ body weights increased at a faster rate than the increase in their fluid intake. The rats in the caffeine group consumed 29.8 mg/kg of caffeine per day on average (Figure 2C).
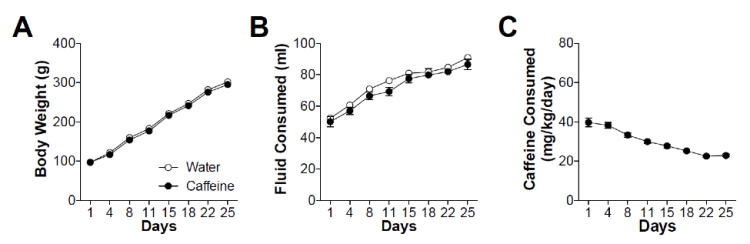
Figure 2: A) This figure shows the average animal weight in the caffeine and water group per day. Rats were weighed every 3-4 days, and the change in weight averaged across the number of days. B) Shows the changes in bottle weight for each day. Bottles were weighed every 3-4 days, and the change in weight averaged across the number of days. This data is for both rats in the cage sharing the bottle. C) Shows the average amount of caffeine consumed by rats in the caffeine group per body weight (kg) per day.
Elevated Plus Maze
We conducted the elevated plus maze to determine if caffeine consumption during adolescence would enhance anxiety-related behavior compared to water-consuming control rats. In an elevated plus maze experiment, anxiety-related behavior is reflected by the animal spending more time in the enclosed arms and less time in the open arms. The rats that consumed caffeine in adolescence showed a significant decrease in the amount of time they spent in the open arms of the elevated plus maze (Figure 3, t17= 3.081, p= 0.0068). The fact that the rats that consumed caffeine during adolescence also spent less time in the open arms suggests that they were more anxious than the control rats.

Figure 3: This figure shows the percent of time spent in open arms of the elevated plus maze for water and caffeine rats. * Significant from water, p = 0.0068.
Corticosterone Levels
Given that the performance on the elevated plus maze was suggestive of heightened anxiety, we next wanted to explore whether the physiological responses to a stressful stimulus similar to that of the elevated plus maze was also disrupted by adolescent caffeine consumption. CORT is a glucocorticoid hormone released from the adrenal gland when the HPA axis is activated in response to a stressful stimulus. Therefore, we would expect to see that when animals are exposed to either caffeine, stress, or both they would have higher CORT levels than the corresponding control. In this experiment, we found a significant effect of treatment (Figure 4, F(1, 51)= 6.49, p= 0.0139) and stress (F(1, 51)= 92.93, p < 0.0001). There was also a significant interaction effect (F(1, 51)= 21.56, p < 0.0001). The interactive effects were further teased apart by t-tests. There were significant differences between stressed and unstressed water animals (t26= 10.53, p < 0.0001) and caffeine animals (t25= 3.360, p= 0.0025). Thus, in both groups, the pedestal stress caused a rise in CORT levels. Additionally, unstressed caffeine animals had higher basal CORT levels than water animals (t36= 2.821, p= 0.0077). However, contrary to what was expected, stress produced a significantly lower CORT response in caffeine animals compared to water animals (t15= 2.834, p= 0.0126).

Figure 4: This figure shows the picograms/deciliter of CORT in trunk blood plasma for each group. * Significant from other treatment in same stress condition; # Significant from same treatment in other stress condition.
C-fos expression changes
To further delineate how caffeine consumption during adolescence may contribute to the disruptions on elevated plus maze and neuroendocrine measures, we sought to identify neuronal activity patterns using c-fos expression. When a neuron is highly activated, the immediate early gene c-fos is transcribed and provides a measure of active neurons (Hoffman, Smith, & Verbalis, 1993). Therefore, we used in situ hybridization to analyze c-fos mRNA levels in various brain regions that have been implicated in anxiety and stress responses. The value for the amount of c-fos is the integrated density. Therefore, the higher the value of integrated density, the more active the brain structure.
Basolateral Amygdala (BLA)
The basolateral amygdala (BLA) was analyzed because of its role in anxiety and emotional memory (Maren, 1999). Since caffeine rats showed more anxiety behavior in the elevated plus maze, we would expect that caffeine rats would show a higher BLA response than the control in reaction to pedestal stress. The region that was quantified for the BLA is shown in Figure 5.

Figure 5: This diagram shows the brain region that was quantified for the BLA. The circle indicates the areas the integrated density values were taken from (50 pixel diameter circle). A value was taken from each side.
There was a significant effect of stress (F(1, 26)= 16.33, p= 0.0004). There was no significant effect of treatment. There was also a significant interaction effect (F(1, 26)= 6.92, p= 0.0142). Caffeine animals that were exposed to stress had higher BLA activation than caffeine animals that had no stress (t13= 4.610, p= 0.0005). There is also a significant difference between caffeine and water animals that received stress (t16= 2.861, p= 0.0113). Rats that consumed caffeine during adolescence had more BLA activation following pedestal stress than the water-consuming rats suggesting that they had significantly more anxiety to the same stressor, consistent with the elevated plus maze results (Figure 6).
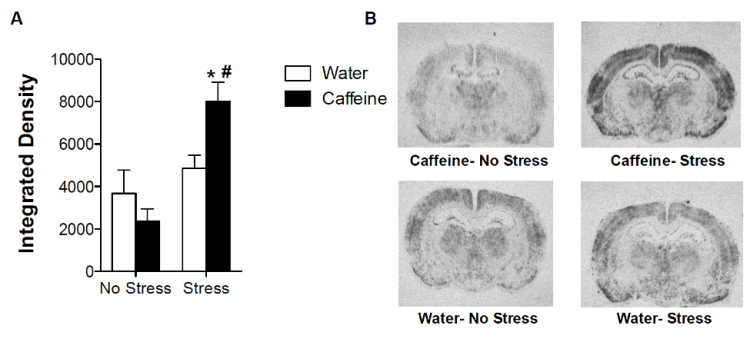
Figure 6: A) This figure shows the integrated density of the BLA c-fos for each group.
* Significant from other treatment in same stress condition; # Significant from same treatment in other stress condition. B) This figure shows an example slice from each group.
Paraventricular Nucleus (PVN)
The paraventricular nucleus (PVN) is the part of the hypothalamus that begins the HPA axis cascade. It is activated by stressful stimuli and natural body rhythms and eventually leads to the release of CORT into the bloodstream. Since the CORT experiment resulted in caffeine rats having a lessened CORT response to a stressor than water rats, we wanted to analyze the PVN to identify whether changes in the CORT response was at the level of the PVN or further downstream. The region that was quantified in the PVN is shown in Figure 7.
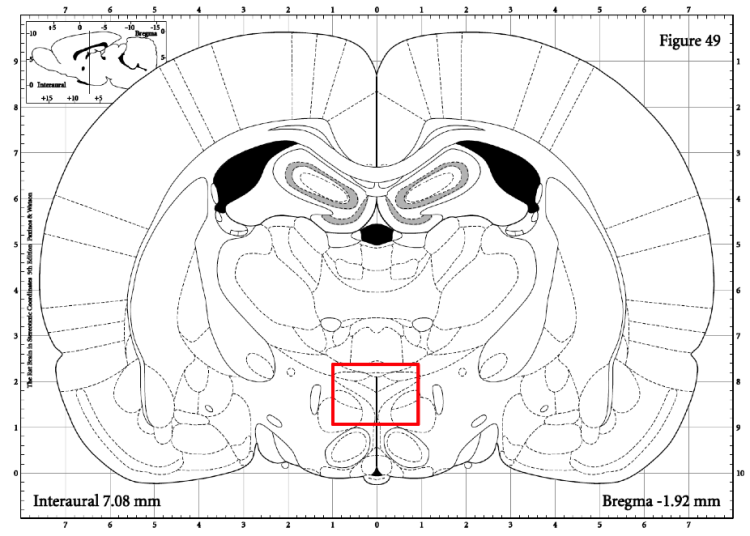
Figure 7: This diagram shows the brain region that was quantified for the PVN. The rectangle indicates the area the integrated density value was taken from (50x45 pixel rectangle).
In the PVN, we found a significant effect of stress (F(1, 26)= 36.36, p < 0.0001). There was also a significant interaction effect (F(1, 26)= 4.39, p= 0.0461). Stress caused a rise in PVN activation for water animals (t13= 5.181, p= 0.0002) and for caffeine animals (t13= 3.160, p= 0.0075). There was also a significant difference between water and caffeine animals with no stress (t10= 2.226, p= 0.05). Thus, in the absence of stress, the caffeine animals had more PVN activity than water animals. A slight decrease can be seen in the caffeine animals PVN activation to a stressor from the water animals (Figure 8). However, since it is not statistically significant, no conclusions can be drawn from the parallel.
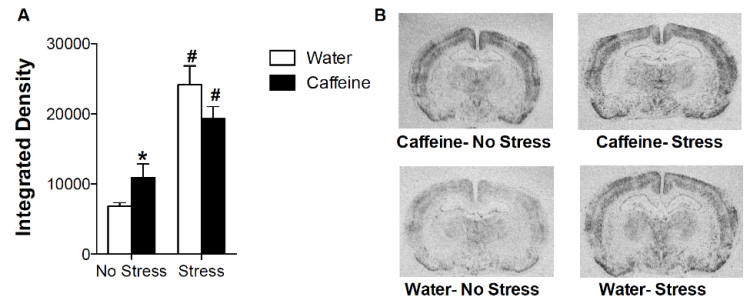
Figure 8: A) This figure shows the integrated density of the PVN c-fos for each group.
* Significant from other treatment in same stress condition; # Significant from same treatment in other stress condition. B) This figure shows an example slice from each group.
Bed Nucleus of Stria Terminalis (BST)
We also analyzed the bed nucleus of the stria terminalis (BST), as it is a relay site between the BLA and PVN and could possibly explain differences in activation between these structures for the same groups. The region that was quantified in the BST is shown in Figure 9. However, the BST had no statistically significant differences in activation between the groups (Figure 10). Interestingly, although not statistically significant, in the no stress condition the caffeine animals had lower BST activation than water animals.
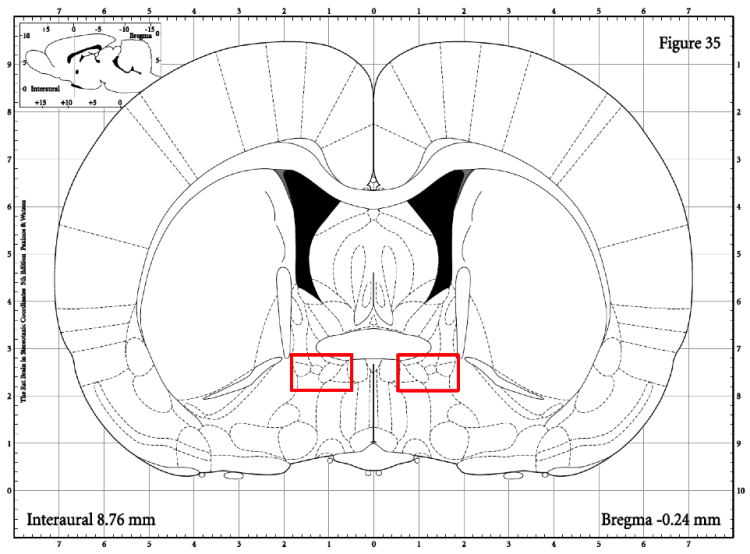
Figure 9: This diagram shows the brain region that was quantified for the BLA. The rectangle indicates the areas the integrated density values were taken from (80x40 pixel rectangle). A value was taken from each side.

Figure 10: A) This figure shows the integrated density of the BST c-fos for each group. There were no significant effects. B) This figure shows an example slice from each group.
Discussion
These studies illustrate the powerful and lasting effects that adolescent caffeine consumption can have in the brain on anxiety and stress systems in rat models. Our results demonstrate that when the rats that consumed caffeine were exposed to an elevated plus maze, they spent significantly less time in open arms implying heightened anxiety. Additionally, rats that consumed caffeine during adolescence had higher basal levels of both PVN activity and CORT levels compared to the control. When the animals were exposed to pedestal stress, the animals that consumed caffeine during adolescence had heightened BLA activity, blunted CORT release, and a trend towards blunted PVN activity. Together, these findings suggest that adolescent caffeine consumption impaired both basal and stress-induced neuroendocrine functioning in adulthood.
Acute caffeine is known to activate the HPA axis. Thus, low dose injections of caffeine have been shown to increase CORT release (Patz et al., 2006). Through this research it is not entirely clear how caffeine activates the HPA axis. The action could occur by some sort of connection with the PVN, which releases CRH. Experiments have shown that when CRH release is blocked, there is no CORT response. Therefore, caffeine could be interacting directly with the PVN or with hypothalamic afferent structures to cause this change in PVN activity and CORT release (Nicholson, 1989; Patz et al., 2006). So far, there is not much information that describes how caffeine could directly modulate the PVN. An afferent region caffeine interacts with is the hippocampus. Caffeine causes the activation of hippocampal CA1 pyramidal neurons (Uneyama, Munakata, & Akaike, 1993). Since caffeine activates the hippocampus which connects to the PVN, a change here could hypothetically change PVN activity. There is little information on caffeine’s effect on any other afferent structures (See Figure 11). The exact region caffeine interacts with to cause a rise in PVN activity could be explored with future experiments.

Figure 11: This figure illustrates some of the connectivity between the limbic system and the HPA axis, but is not a complete list. Green arrows indicate excitatory connections, while red arrows indicate inhibitory connections.
Caffeine seems to be acting as a stressor given that acute caffeine activates the HPA axis (Patz et al., 2006). Thus chronic consumption of caffeine, and activation of the HPA axis, may be similar to chronic stress conditions. Our findings are consistent with other findings that demonstrate chronic stress causes an increase in basal CORT in animal models (Mizoguchi & Yuzurihara, 2001). Additionally, caffeine’s stimulant effects could be acting as a stressor by altering sleep/wake patterns. Since the animals are exposed to caffeine at all hours, drinking caffeine-containing water throughout the day may disrupt their sleeping patterns producing more bouts of wakefulness. Caffeine has been shown to induce a dose-dependent increase in waking (Schweirin, Borbély, & Tobler, 1996). This change in the sleep cycle could affect the activity of the HPA axis. For example, it has been demonstrated that awakenings and the offset of sleep are both accompanied by secretion of CORT (Balbo, Leproult, & Van Cauter, 2010). Since caffeine is releasing CORT, and CORT causes more waking and less sleeping, the caffeine-consuming rats could be living under the stressful condition of disrupted sleep patterns.
The animals were exposed to pedestal stress to determine if chronic caffeine consumption in adolescence affected the response rats exhibited to an acute novel stressor. When rats in the water or the caffeine group were exposed to pedestal stress, there was an increase in PVN activity and a corresponding increase in CORT levels from the unstressed animals. This finding confirms that an acute stressor activates the PVN and causes a CORT response. Unexpectedly, the CORT analysis showed that in the stress group caffeine rats had a significantly lower level of stress-induced CORT than water rats. The PVN c-fos data illustrates a trend that correlates with the CORT result, although this was not statistically significant. A similar effect was seen in an experiment in which mice were selectively bred to be highly anxious. When these high anxiety mice were exposed to an acute stressor, such as pedestal stress, there was a blunted CORT response (Sotnikov et al., 2014). Plausibly, the caffeine consumption during adolescence rendered these rats more anxious (as seen by the heightened BLA activity under unstressed conditions), which caused them to display the blunted CORT response. A reason this could occur is that their HPA axis compensated and adjusted to the higher basal levels by blunting CORT release to prevent damage due to an excess of it in the body (Fries, Hesse, Hellhammer, & Hellhammer, 2005). This process could potentially occur through an upregulation of the glucocorticoid receptor in the PVN (Sotnikov et al., 2014), although this explanation does not fit with our result of heightened basal CORT.
Adolescent caffeine consumption produced robust behavioral differences in elevated plus maze. Rats that consumed caffeine spent less time in the open arms of the maze, indicating heightened anxiety. The amygdala is a comprised of many subregions that orchestrate emotional processing and emotional learning. The BLA, in particular, has been found to be the region where emotional memories are modulated (Maren, 1999). We observed significantly higher stress-induced levels of c-fos in the BLA of rats that consumed caffeine during adolescence. All of these observations suggest that caffeine has an effect on the brain that causes the BLA to have a larger reaction to stress, potentially producing heightened anxiety. Interestingly, acute caffeine has been shown to activate interneurons within the BLA (Hale et al., 2010). Thus, since the BLA has been implicated in anxiety (Davidson, 2002) and caffeine activates the BLA, chronic caffeine consumption during adolescence may produce enduring effects in the BLA that leads to heightened sensitivity producing more anxiety in response to a stressful situation.
The BLA is also positioned to modulate the PVN through connections with both the BST and the central nucleus of the amygdala (CeA) (Herman et al., 2003). The CeA serves as the primary output of the amygdala and sends excitatory information directly to the PVN. The CeA also has indirect communication to the PVN through excitatory and inhibitory connections with the BST. The BST is a complex structure consisting of different subnuclei that differentially signal the PVN (Choi, Willett, & Curhan, 2007). The BLA and CeA can therefore bidirectionally modulate the output of the BST. Thus, the complex circuitry and communication between these structures make interpretations of our c-fos expression data difficult.
Nonetheless, we suspect that caffeine consumption during adolescence has rendered the BST dysfunctional. Since the BLA and PVN are showing different responses to the same stressor, and typically the BLA activates the PVN, there is a possibility there is a change in function of the structure that connects the two—the BST (Herman et al., 2003). We were looking specifically at the anteroventral BST, which normally excites the HPA axis (Choi et al., 2007). We did not observe the characteristic stress-induced increase in BST activity, which supports BST dysfunction. However, the water animals did not show any change in BST activation in response to a stressor (possibly because the stressor was too mild).
It is important to note that our behavioral, neuroendocrine and brain changes are observed following the consumption of caffeine for the duration of their adolescence. This implies that caffeine could be causing a change during the development of the brain that changes its response to subsequent stressful stimuli. Caffeine can have many long-term effects on the brain, such as changing receptor density (Hawkins et al., 1988). If changes are occurring in the vulnerable adolescent brains of rat models, it is possible that there is a developmental effect contributing to our results. An interesting study would be to identify different stages throughout adolescent development that may be particularly sensitive to the changes in anxiety and stress responses that we observe.
Chronic caffeine consumption is associated with withdrawal symptoms. Therefore, possibly heightened anxiety is a manifestation of caffeine withdrawal. Studies have demonstrated that after chronic caffeine administration in adolescence, rats develop signs of withdrawal that do not appear after chronic caffeine administration in adulthood (Rhoads, Huggler, & Rhoads, 2011). When withdrawing from opiates, rats have shown heightened anxiety in these periods of withdrawal (Aston-Jones & Harris, 2004). Since caffeine causes withdrawal and withdrawal can raise anxiety, we cannot exclude the possibility that the rise in anxiety behavior could be due to a withdrawal effect.
In conclusion, we found that chronic caffeine consumption in adolescent rats leads to higher basal CORT release and PVN activity. In response to a stressor, chronic caffeine consumption leads to heightened BLA activity and anxiety behavior but blunted CORT release. Although more studies need to be done, these results may suggest that the consumption of caffeine in adolescence can have unwanted effects on stress reactivity in adulthood.
References
Aston-Jones, G., & Harris, G. C. (2004). Brain substrates for increased drug seeking during protracted withdrawal. Neuropharmacology, 47, 167-179.
Babb, J. A., Masini, C. V, Day, H. E. W., & Campeau, S. (2014). Habituation of hypothalamic-pituitary-adrenocortical axis hormones to repeated homotypic stress and subsequent heterotypic stressor exposure in male and female rats. Stress (Amsterdam, Netherlands), 17(3), 224–34. doi:10.3109/10253890.2014.905534
Balbo, M., Leproult, R., & Van Cauter, E. (2010). Impact of sleep and its disturbances on hypothalamo-pituitary-adrenal axis activity. International journal of endocrinology, 2010.
Chiu, R., Boyle, W. J., Meek, J., Smeal, T., Hunter, T., & Karin, M. (1988). The c-Fos protein interacts with c-Jun/AP-1 to stimulate transcription of AP-1 responsive genes. Cell, 54(4), 541–52. Retrieved from http://www.ncbi.nlm.nih.gov/pubmed/3135940
Choi, H. K., Willett, W., & Curhan, G. (2007). Coffee consumption and risk of incident gout in men: a prospective study. Arthritis and Rheumatism, 56(6), 2049–2055.
Daly, J. W. (2007). Caffeine analogs: biomedical impact. Cellular and Molecular Life Sciences: CMLS, 64(16), 2153–2169.
Daniels, J. W., Molé, P. A., Shaffrath, J. D., & Stebbins, C. L. (1998). Effects of caffeine on blood pressure, heart rate, and forearm blood flow during dynamic leg exercise. Journal of Applied Physiology, 85(1), 154-159.
Davidson, R. J. (2002). Anxiety and affective style: role of prefrontal cortex and amygdala. Biological Psychiatry, 51(1), 68–80. doi:10.1016/S0006-3223(01)013282
Philosophical Transactions of the Royal Society of London. Series B, Biological Sciences, 352(1362), 1675–87. doi:10.1098/rstb.1997.0149
Day, H. E. W., & Akil, H. (1996). Differential pattern of c-fos mRNA in rat brain following central and systemic administration of lnterleukin-1-Beta: Implications for mechanism of action. Neuroendocrinology, 63(3), 207-218.
Day, H. E. W., Nebel, S., Sasse, S., & Campeau, S. (2005). Inhibition of the central extended amygdala by loud noise and restraint stress. The European Journal of Neuroscience, 21(2), 441–54. doi:10.1111/j.1460-9568.2005.03865.x
Dickerson, S. S., & Kemeny, M. E. (2004). Acute stressors and cortisol responses: A theoretical integration and synthesis of laboratory research. Psychological Bulletin, 130, 355–391.
Frary, C. D., Johnson, R. K., & Wang, M. Q. (2005). Food sources and intakes of caffeine in the diets of persons in the United States. Journal of the American Dietetic Association, 105(1), 110-113.
Fredholm, B. B., Bättig, K., Holmén, J., Nehlig, A., & Zvartau, E. E. (1999). Actions of caffeine in the brain with special reference to factors that contribute to its widespread use. Pharmacological Reviews, 51(1), 83–133.
Fries, E., Hesse, J., Hellhammer, J., & Hellhammer, D. H. (2005). A new view on hypocortisolism. Psychoneuroendocrinology, 30(10), 1010–6. doi:10.1016/j.psyneuen.2005.04.006
Gladwin, T. E., Figner, B., Crone, E. A., & Wiers, R. W. (2011). Addiction, adolescence, and the integration of control and motivation. Developmental Cognitive Neuroscience, 1(4), 364-376.
Goliszek, A.G., Crawford, G.E., Lawrence, H.S., Bennet, J., Williams, F., & Hurley, S. L. (1996). Effects of prepubertal stress on subsequent ACTH response to novel stress and CRH in male vs female rats. Stress Medicine, 12(3), 199-204.
Hale, M. W., Johnson, P. L., Westerman, A. M., Abrams, J. K., Shekhar, A., & Lowry, C. A. (2010). Multiple anxiogenic drugs recruit a parvalbumin-containing subpopulation of GABAergic interneurons in the basolateral amygdala. Progress in Neuro-Psychopharmacology & Biological Psychiatry, 34(7), 1285–93. doi:10.1016/j.pnpbp.2010.07.012
Harnack, L., Stang, J., & Story, M. (1999). Soft drink consumption among U.S. children and adolescents: nutritional consequences. Journal of the American Dietetic Association, 99(4), 436-441.
Hawkins, M., Dugich, M. M., Porter, N. M., Urbancic, M., & Radulovacki, M. (1988). Effects of chronic administration of caffeine on adenosine A1 and A2 receptors in rat brain. Brain Research Bulletin, 21(3), 479–82. Retrieved from http://www.ncbi.nlm.nih.gov/pubmed/3214753
Herman, J. P., Figueiredo, H., Mueller, N. K., Ulrich-Lai, Y., Ostrander, M. M., Choi, D. C., & Cullinan, W. E. (2003). Central mechanisms of stress integration: hierarchical circuitry controlling hypothalamo–pituitary–adrenocortical responsiveness. Frontiers in Neuroendocrinology, 24(3), 151–180. doi:10.1016/j.yfrne.2003.07.001
Hoffman, G. E., Smith, M. S., & Verbalis, J. G. (1993). c-Fos and related immediate early gene products as markers of activity in neuroendocrine systems. Frontiers in Neuroendocrinology, 14(3), 173–213. doi:10.1006/frne.1993.1006
Holtzman, S. G. (1983). Complete, reversible, drug-specific tolerance to stimulation of locomotor activity by caffeine. Life Sciences, 33(8), 779-787.
Jacobson, K. A., von Lubitz, D. K. J. E., Daly, J. W., & Fredholm, B. B. (1996). Adenosine receptor ligands: differences with acute versus chronic treatment. Trends in Pharmacological Sciences, 17(3), 108–113.
Maren, S. (1999). Long-term potentiation in the amygdala: a mechanism for emotional learning and memory. Trends in Neurosciences, 22(12), 561–567.
Mizoguchi, K., Yuzurihara, M., Ishige, A., Sasaki, H., Chui, D. H., & Tabira, T. (2001). Chronic stress differentially regulates glucocorticoid negative feedback response in rats. Psychoneuroendocrinology, 26(5), 443–459.
Nakajima, T., Daval, J. L., Morgan, P. F., Post, R. M., & Marangos, P. J. (1989). Adenosinergic modulation of caffeine-induced c-fos mRNA expression in mouse brain. Brain Research, 501(2), 307–14. Retrieved from http://www.ncbi.nlm.nih.gov/pubmed/2510904
Nicholson, S. A. (1989). Stimulatory effect of caffeine on the hypothalamo-pituitary-adrenocortical axis in the rat. The Journal of Endocrinology, 122(2), 535–543.
Pace, T. W., Gaylord, R., Topczewski, F., Girotti, M., Rubin, B., & Spencer, R. L. (2005). Immediate–early gene induction in hippocampus and cortex as a result of novel experience is not directly related to the stressfulness of that experience. European Journal of Neuroscience, 22(7), 1679-1690.
Patz, M. D., Day, H. E. W., Burow, A., & Campeau, S. (2006). Modulation of the hypothalamo-pituitary-adrenocortical axis by caffeine. Psychoneuroendocrinology, 31(4), 493–500. doi:10.1016/j.psyneuen.2005.11.008
Rhoads, D. E., Huggler, A. L., & Rhoads, L. J. (2011). Acute and adaptive motor responses to caffeine in adolescent and adult rats. Pharmacology, Biochemistry, and Behavior, 99(1), 81–6. doi:10.1016/j.pbb.2011.04.001
Rosin, D. L., Robeva, A., Woodard, R. L., Guyenet, P. G., & Linden, J. (1998). Immunohistochemical localization of adenosine A2A receptors in the rat central nervous system. Journal of Comparative Neurology, 401(2), 163-186.
Schwierin, B., Borbély, A., & Tobler, I. (1996). Effects of N6-cyclopentyladenosine and caffeine on sleep regulation in the rat. European Journal of Pharmacology, 300, 163–171. Retrieved from http://www.sciencedirect.com/science/article/pii/0014299996000210
Sotnikov, S., Wittmann, A., Bunck, M., Bauer, S., Deussing, J., Schmidt, M., … Czibere, L. (2014). Blunted HPA axis reactivity reveals glucocorticoid system dysbalance in a mouse model of high anxiety-related behavior. Psychoneuroendocrinology, 48, 41–51. doi:10.1016/j.psyneuen.2014.06.006
Spear, L. P. (2004). Adolescent brain development and animal models. Annals of the New York Academy of Sciences, 1021(1), 23-26.
Steinberg, L. (2005). Cognitive and affective development in adolescence. Trends in Cognitive Sciences, 9(2), 69–74. doi:10.1016/j.tics.2004.12.005
Svenningsson, P., Johansson, B., & Fredholm, B. B. (1996). Caffeine-induced expression of c-fos mRNA and NGFI-A mRNA in caudate putamen and in nucleus accumbens are differentially affected by the N-methyl-D-aspartate receptor antagonist MK-801. Brain Research. Molecular Brain Research, 35(1-2), 183–189.
Temple, J. L. (2009). Caffeine use in children: what we know, what we have left to learn, and why we should worry. Neuroscience & Biobehavioral Reviews, 33(6), 793-806.
Tsigos, C., & Chrousos, G. P. (2002). Hypothalamic-pituitary-adrenal axis, neuroendocrine factors and stress. Journal of Psychosomatic Research, 53(4), 865–71. Retrieved from http://www.ncbi.nlm.nih.gov/pubmed/12377295
Uhde, T., Boulenger, J. P., Jimerson, D., & Post, R. (1984). Caffeine: Relationship to Human Anxiety, Plasma MHPG, and Cortisol. Psychopharmacology Bulletin, 20, 426–430.
Uneyama, H., Munakata, M., & Akaike, N. (1993). Caffeine response in pyramidal neurons freshly dissociated from rat hippocampus. Brain Research, 604(1-2), 24–31.
Wagner, E. F. (2001). AP-1--Introductory remarks. Oncogene, 20(19), 2334–5. doi:10.1038/sj.onc.1204416
The Minimal Elements Required for Clustering of Core Complexes in the Escherichia coli Chemosensory Pathway, Jane Duplantis
TABLE OF CONTENTS
I. Acknowledgements
II. Abstract
III. Introduction
IV. Materials and Methods
a. Materials
b. Strains and Plasmids
c. Cell Growth Conditions
d. Imaging via Fluorescent Microscopy
V. Results
a. Strategy for Strain and Plasmid Selection
b. Determining the Array Binding Parameters for YFP-Fusion Proteins
c. Use of YFP-Fusion Proteins to Monitor or Modulate Receptor Localization and Array Formation
d. Determining the Array Binding Parameters of Mutant YFP-CheA-HK-P5 Domains
VI. Discussion
VII. References
Abstract
In the chemotaxis pathway in bacteria, chemotactic stimuli are sensed by thousands of chemosensory core complexes that have localized to the cell poles to form chemosensory arrays.2 The chemosensory arrays allow for amplified signal transduction that modulates the rotation of the bacteria’s flagella. This directs the movement of the cell up an attractant gradient or down a repellent gradient. The three chemosensory proteins that form the core complexes are histidine kinase CheA (CheA-HK), adaptor protein CheW (CheW-AP), and receptor. The chemosensory core complex is the functional unit of the array and consists of a pair of receptor oligomers (each a trimer of dimers) that are bridged by a single CheA-HK dimer in a complex stabilized by two CheW-AP monomers. In the assembled array, the core complexes are bound to one another through a network of interconnected rings formed by the P5 domain of CheA-HK alternating with the structurally homologous CheW-AP protein to yield a hexagonal array of receptor oligomers (Fig. 1). By using chemotactic proteins that are fluorescently labeled, previous in vivo studies have shown that chemosensory complexes localize to the cell poles and can form either tight, point-like clusters or diffuse, cap-like clusters.3 Point-like, tight clusters are indicative of standard array formation, in which the chemosensory proteins are locked into the tightly-packed hexagonal lattice. Diffuse clusters or caps indicate that the array is not properly formed, allowing the proteins to spread out more freely at the pole. These previous studies have shown that CheA-HK, CheW-AP, and receptors form tight clusters, while receptors in the absence of CheA-HK and CheW-AP form diffuse clusters.3 The current study seeks to systematically analyze the effects of CheA-HK, its isolated regulatory domain P5, and CheW-AP on array formation in five different modified cell backgrounds lacking one or more of the three core array components. The results confirm the previous observation that tight receptor clusters are observed in the presence of CheA-HK and CheW-AP or in the presence of CheW-AP alone.
The observation that CheW-AP alone can stabilize tight receptor clusters, together with published structural studies of array components, led us to develop a working model for the minimal architecture required for tight cluster formation. The model draws from the known structure of the hexagonal, interconnected rings formed by CheA-HK and CheW-AP in membrane-bound, native arrays and soluble fragment arrays. The model proposes that tight cluster formation requires just two architectural elements: (i) the receptor oligomers and (ii) hexagonal rings of CheW-AP, and, when present, the P5 domain of CheA-HK that stabilizes the hexagonal packing of the receptors. Notably, the CheA-HK-P5 domain and the CheW-AP protein are homologous and share the same dual SH3-like architecture. The model proposes that the isolated CheA-HK-P5 domain, like CheW-AP, might be able to form hexagonal rings by itself or incorporate into rings with CheW-AP that stabilize tight clusters. The current studies of fluorescent fusion proteins binding to receptor clusters in live cells indicate that the isolated CheA-HK-P5 domain fails to incorporate into clusters in the absence of CheW-AP, but can incorporate together with CheW-AP into tight clusters. These findings provide strong evidence that support a model in which the native hexagonal rings formed by CheA-HK and CheW-AP in wild-type arrays can be formed by the isolated CheA-HK-P5 domain and CheW-AP in the absence of the other CheA-HK domains. To further test this model, mutations were introduced on the surface of the CheA-HK-P5 domain that were predicted to interact with CheW-AP. These mutations were observed to disrupt CheA-HK-P5 incorporation into clusters. Overall, the results strongly suggest that the CheA-HK-P5 domain possesses the full complement of CheA-HK interaction surfaces necessary to form hexagonal rings with receptor and CheW-AP.
Introduction
The chemotaxis pathway is a signaling system that enables bacteria to migrate toward attractant gradients or away from repellent gradients. In Escherichia coli, the chemosensory core complex is the minimal functional unit of the chemosensory array that can produce receptor-mediated kinase activity.4 The core complex consists of a histidine kinase CheA (CheA-HK) and an adaptor protein CheW (CheW-AP) that are bound to the cytoplasmic tips of transmembrane chemoreceptors.5 CheA-HK is a homodimer in which each identical subunit is divided into five domains, P1-P5, where P5 is the regulatory domain that is bound to CheA-HK through CheW-AP.6 When a core complex senses an attractant or repellent molecule, the catalytic P4 domain transfers a phosphate from ATP to a His side chain on the P1 substrate domain. P2 binds CheY, a response regulator protein, which positions CheY to receive the phosphate group from P1. Phosphorylated CheY diffuses to the motor where it modulates the switching of the flagella between its two rotational and swimming states, CW (tumbling) and CCW (smooth swimming). By alternating the rotation of the flagella, the bacteria cell is able to migrate in a series of steps and tumbles up or down a gradient. Other chemotactic proteins, CheR-methyltransferase (CheR-MT) and CheB, control the methylation state of the receptor adaptation sites, allowing the pathway to adapt to the changing background level of stimulus as it moves in the gradient.5
Thousands of chemosensory core complexes join together at the poles of cells to form chemosensory arrays that sense chemotactic stimuli.2 Using fluorescent microscopy and fluorescently labeled chemotactic proteins, previous studies have been able to visualize these clusters in live cells, which appear as point-like, tight clusters or cap-like, diffuse clusters.7 The formation of the native, hexagonal chemosensory array yields tight polar clusters, whereas diffuse clusters or caps suggest that native arrays are not being formed, allowing the receptors to spread throughout the polar region. The localization of thousands of core complexes to the cell poles and the formation of native arrays allow the cell to amplify and transmit signal to downstream proteins and the flagella in order to direct the cell’s movement in a cooperative manner. Despite the integral role of chemosensory arrays in signal transduction, the protein-protein interactions essential for stabilization of the array architecture are still not fully understood.3 A preliminary model for chemosensory protein interactions was first outlined when a crystal structure of the cytoplasmic domain of the serine receptor, Tsr, revealed a trimer of receptor dimers connected at the signaling tip.8,9

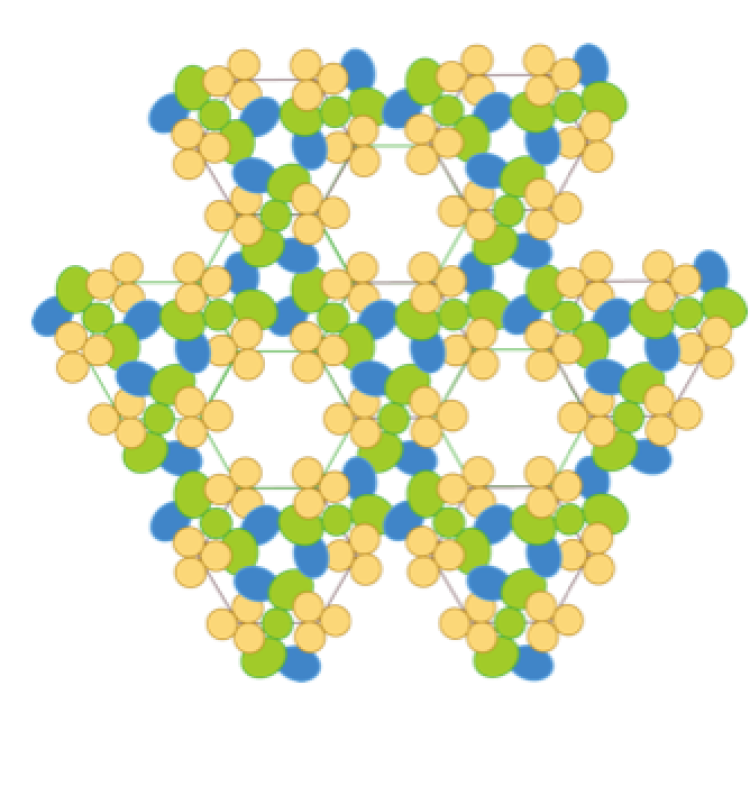
Figure 1. A) Electron density model of the chemosensory array created from cryo-EM, crystallography, and cross-linking studies. Three core complexes form this array. Green: histidine kinase CheA-HK. Blue: adaptor protein CheW-AP. Beige: serine receptor. B) 2-D geometric depiction of the chemosensory array assembled in a hexagonal lattice. The serine receptor (beige) forms trimers of dimers, which sit at each of the corners of the hexagon.10
Around the same time, it was proposed that CheA-HK and CheW-AP were required for receptor cluster formation, since reduced clustering occurred in the absence of CheA-HK and CheW-AP.11,7 A cross-linking study echoed a similar theory by showing that the binding of CheA-HK and CheW-AP to receptor complexes stabilized array formation.12 Combining the trimer of receptor dimers model with crystallographic and cryo-EM evidence for the role of CheA-HK and CheW-AP in cluster formation led to the current model of the chemosensory array (Fig. 1). In this model, the cytoplasmic tips of the trimers of receptor dimers bind to CheA-HK through CheW-AP and are connected by the dimeric CheA-HK, forming a hexagonal lattice arrangement.13 However, more recent studies have challenged this model by showing that CheA-HK and CheW-AP enhance receptor clustering, but only CheW and receptor are required for tight cluster formation.3 The CheR-methyltransferase (CheR-MT) protein, one of the adaptation enzymes, binds to the C-terminus of receptors and can be used to visualize the clustering state of the receptor population. By attaching a yellow fluorescent protein (YFP) tag to CheR-MT and transforming it into a cell strain lacking CheA-HK and CheW-AP, the study was able to show receptor localization in diffuse clusters. This is in contrast to the tight clusters that were observed when CheR-MT was introduced to wild-type cells containing CheA-HK and CheW-AP. When a YFP-CheW-AP fusion protein was transformed into a strain lacking CheA-HK and CheW-AP, the clusters resembled the wild-type, tight clusters. Since tight clusters indicate array formation, the result suggested that YFP-CheW-AP alone was able to stabilize the receptor array, and that CheA-HK dimers were not required for cluster formation.
The finding that CheW-AP alone can stabilize tight receptor clusters, along with other structural studies of the array components, has led to the development of a new working model for the architecture required for tight cluster formation. The model proposes that tight cluster formation requires receptor oligomers and hexagonal, interconnected rings of CheW-AP. When the P5 domain of CheA-HK is present, the model suggests that CheW-AP and CheA-HK-P5 can also stabilize the hexagonal packing of the receptors in order to produce tight clusters. Since CheA-HK-P5 and CheW-AP are homologous proteins, the model proposes that isolated CheA-HK-P5, like CheW-AP, might be able to form hexagonal rings by itself. However, the results of the current study indicate that CheA-HK-P5 fails to incorporate into clusters in the absence of CheW-AP but can incorporate with CheW-AP into tight clusters when CheW-AP is present. These findings provide strong evidence for a model in which the native hexagonal rings formed by CheA-HK and CheW-AP in wild-type arrays can also be formed by CheA-HK-P5 and CheW-AP in the absence of the other CheA domains. To further test this model, mutations were introduced on the surface of the CheA-HK-P5 domain that were predicted to disrupt protein interactions with CheW-AP. As expected, the mutations were observed to disrupt CheA-HK-P5 incorporation into clusters. Overall, the results strongly suggest that CheA-HK-P5 is able to form interconnected, hexagonal rings with receptor and CheW-AP.
Elucidating the key architectural features of the chemosensory array is not only an important area for bacterial chemotaxis research but also for clinical and diagnostic applications. New, broad-spectrum antibiotics could be designed to inhibit array assembly or stability and block bacterial migration to wounds. Such antibiotics would likely have minimal toxic effects in humans and animals, since they would target chemosensory proteins that are evolutionarily conserved in chemotactic bacteria and do not exist in cells of high-order organisms.5 Another promising application is biosensor development. By designing a biological tranducer to recognize a specific analyte, such as a drug or toxin, the concentration of the analyte could be detected with high sensitivity and dynamic range. Thus, further understanding of array architecture has broad implications.
Materials and Methods
Materials
Reagent grade chemicals were obtained from Sigma unless otherwise noted. The YFP-fusion expression plasmids employed (YFP-CheR-MT (pDK20), YFP-CheW-AP (pDK12), YFP-CheA-HK (pDK28), and YFP-CheA-HK-P5 (pDK36)), were gifts from the Parkinson and Sourjik labs.7 The cell strains employed (Table 1; RP437, RP9535, UU1607, UU2734, UU2612, and UU2682) were gifts from the Parkinson lab.14
Strains and Plasmids
The YFP-fusion plasmids were previously constructed using the following procedure.7 The desired target gene (CheA-HK, CheR-MT, or CheW-AP) and the yellow fluorescent protein (YFP) gene were amplified via PCR, using primers with a GGGSV linker. A second round of PCR produced fragments with the target protein attached to YFP via the GGGSV linker. The YFP-fusion sequences were then cloned into the expression vector, pDK4, near the pTRC promoter to form YFP-CheA-HK (pDK28), YFP-CheR-MT (pDK20), and YFP-CheW-AP (pDK12). YFP-CheA-HK-P5 (pDK36) was formed by isolating the P5 domain of YFP-CheA-HK, amplifying it via PCR, and cloning it back into the pDK4 expression vector.
A few features of the YFP-fusion plasmids make them particularly desirable for experimental use. The pTRC promoter in the YFP-fusion plasmid enables expression of YFP-fusion proteins when induced by Isopropyl-β-D-1-thiogalactopyranoside (IPTG). This feature allows for controlled expression of the YFP-fusion proteins during experiments. The pDK4 vector contains an ampicillin resistant gene, which allows for selective uptake of YFP-fusion plasmids into cells growing in media containing ampicillin.15 Ampicillin resistance increases the likelihood that the YFP-fusion plasmids will be the only plasmids taken up and incorporated into cells’ genomes, while control over protein expression allows for optimal imaging of chemoreceptor clusters once the YFP-fusion proteins are expressed.
Six Escherichia coli cell strains, RP437, RP9535, UU1607, UU2734, UU2612, and UU2682, were used in this study. All strains were derived from the wild type strain, RP437, and were obtained from the Parkinson lab.14 Each modified strain lacked one or more of the CheA-HK, CheW-AP, and receptor genes, which code for the chemosensory proteins that form the core complex (Table 1). For ease of comprehension, strains may also be referred to as +A+W+R (RP437), -A-W-R (UU2682), -A-W+R (UU1607), +A+W-R (UU2612), +A-W+R (UU2734), and –A+W+R (RP9535) from this point on.
|
|
RP437 |
UU2682 |
UU1607 |
UU2612 |
UU2734 |
RP9535 |
|
CheA-HK |
+ |
- |
- |
+ |
+ |
- |
|
CheW-AP |
+ |
- |
- |
+ |
- |
+ |
|
Receptor |
+ |
- |
+ |
- |
+ |
+ |
Table 1. Description of cell strains used in experiments. Pluses and minuses indicate the presence or absence, respectively, of CheA-HK, CheW-AP, and receptor genes in cell strains.
Cell Growth Conditions
A YFP-fusion plasmid was transformed into each of the six E. coli strains previously described and grown overnight at 37° C on media plates containing ampicillin (100 μg/mL). One colony was selected for each strain and grown overnight at 30° C in 4 ml of VBC-HMLTT Minimal Essential Media (20 mM lactate, 40 μg/mL D,L-histidine, 20 μg/mL L-leucine, 1 μg/mL thiamine, 0.75% glycerol, 100 μg/mL ampicillin).14,16-18 After overnight growth, the samples underwent a 1:10 dilution with new minimal media and were placed in a shaking incubator at 30° C for about four hours or until an optical density of 0.4-0.9 was reached. The cells were then induced with Isopropyl β-D-1-thiogalactopyranoside (50 μM IPTG), prompting the expression of the YFP-fusion protein. After induction, the cells were placed back into the shaking incubator at 30° C for two hours until they achieved mid-log growth. An aliquot of 9 mL was removed from each cell culture and centrifuged at 3200 xg for 5 minutes, producing a compact cell pellet. The cell pellet was resuspended in 700 μL of tethering buffer (10 mM potassium phosphate, 0.1 mM EDTA, 1 mM L-methionine, 10 mM sodium lactate, pH 7.0)19 and centrifuged again at 3200 xg for 5 minutes. The new cell pellet was resuspended in 50 μL of tethering buffer. Microscopy slides were prepared by adding 20 μL of the resuspended cell sample to a thin agarose pad (0.1% agarose in tethering buffer) and covered with a coverslip. Cells were immediately imaged after slide preparation.
Imaging via Fluorescent Microscopy
After aliquoting cells onto microscopy slides, the cells were imaged using a Nikon TE-2000-E microscope with a 60x oil immersion objective, CFP/YFP/RFP dichroic mirror, and CoolSNAP ES camera with an exposure time of 600 ms. A mercury lamp provided excitation light with a wavelength of 490-500 nm and emissions of 520-560 nm.
Results
Strategy for Strain and Plasmid Selection
Previous studies have explored the effects of YFP-fusion proteins on receptor localization and clustering in certain cell strains. Studies have shown that YFP-CheA-HK does not localize in strains lacking CheW-AP or in receptorless strains [Δ(Tar, Tsr, Tap, Trg)].11,7 Another study showed that YFP-CheR-MT did not localize in a receptorless strain but did localize and form tight, polar clusters in a strain with only CheA-HK, CheW-AP, and Tsr.3 YFP-CheR-MT also localized in a strain with only Tsr, although the clusters were more diffuse, and many of the cells displayed polar caps. Diffuse clusters and polar caps indicate that YFP-CheR-MT was binding to receptor at the poles, but arrays were not forming. The same study also tested the effects of YFP-CheW-AP, YFP-CheA-HK, and YFP-CheA-HK-P5 on cluster formation in wild-type cells (RP437) and the strain with only Tsr. Results showed that YFP-CheW-AP and YFP-CheA-HK-P5 formed tight, polar clusters in wild-type cells and the Tsr strain. YFP-CheA-HK formed tight, polar clusters in wild-type cells but did not localize or form clusters in the Tsr strain. In summary, previous studies have examined YFP-CheA-HK, YFP-CheW-AP, and YFP-CheA-HK-P5 in wild-type cells and Tsr-only cells, YFP-CheA-HK and YFP-CheR-MT in receptorless strains, and YFP-CheR-MT in a strain with only Tsr and a strain with only CheA-HK, CheW-AP, and Tsr.
This study attempted to construct a more comprehensive and systematic approach for testing the effects of YFP-fusion proteins on receptor localization and clustering. This was done in two ways: a) The YFP-fusion proteins that were selected for testing consisted of all major proteins that form the chemosensory array (CheA-HK, CheW-AP, and CheA-HK-P5) and CheR-MT. b) The strains that were selected for testing consisted of all reasonable combinations of the presence or deletion of receptor, CheA-HK, and CheW-AP genes (+A+W+R, -A-W-R, -A-W+R, +A+W-R, +A-W+R, and –A+W+R). This experimental design allowed for the hypothesis of the study to be tested and to expand the experiments of previous studies. For example, by transforming YFP-CheA-HK into –A+W+R and -A-W+R and analyzing the cluster formation, it could be determined if CheA-HK was able to bind to receptor and stabilize the formation of an array without CheW-AP. By transforming YFP-CheW-AP into –A+W+R and -A-W+R, it could be determined if CheW-AP was able to bind to receptor and stabilize the formation of an array without CheA-HK by forming a ring with other CheW-AP proteins.
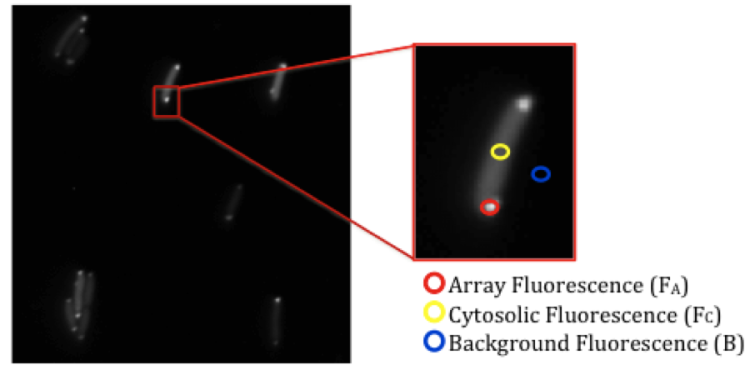
Figure 2. Measuring the fluorescent intensity of a cell. After imaging cells with a 60x objective, the array fluorescence (inside red circle, FA), cytosolic fluorescence (gold circle, FC), and the background fluorescence (blue circle, B) are each measured over a 2x2 pixel area.10
Determining the Array Binding Parameters for YFP-Fusion Proteins
While fluorescent microscopy images can be a useful, qualitative depiction of receptor localization and clustering, it can also be helpful to have a quantitative representation. The degree to which a YFP-fusion protein binds to an in vivo receptor cluster can be described by an incorporation parameter. To determine this parameter, cells are first imaged using a 60x objective. The fluorescent intensity of the array, cytosol, and background of a cell are measured over a 2x2 pixel area (Fig. 2). Applying Equation 1 to the measured intensities corrects for fluctuations in the expression levels of the YFP-fusion proteins that can occur in cells.
AIntensity = (FA-B) / (FC-B) (Eq. 1)10
Corrected fluorescent intensity, AIntensity, for an array in a given cell, where FA = array fluorescence, FC = cytosolic fluorescence, B = background fluorescence.
The corrected array fluorescent intensity, AIntensity, is then normalized by Equation 2 to produce ABound, which is the array incorporation parameter for the YFP-fusion protein in a particular cell strain relative to the wild-type strain.
ABound = (IE-I0) / (IWt-I0) (Eq. 2)10
Normalized incorporation parameter, ABound, for a cell, where
IE = corrected fluorescent intensity for a YFP-fusion protein in an experimental strain,
I0 = corrected fluorescent intensity for a YFP-fusion protein in the -A-W-R control strain,
IWt = corrected fluorescent intensity for a YFP-fusion protein in the wild-type control strain.
The corrected fluorescent intensity for a YFP-fusion protein in wild-type is the positive control (IWt) and has a binding parameter of 1 because all YFP-fusion plasmids exhibit binding in wild-type cells. The corrected fluorescent intensity for a YFP-fusion protein in
-A-W-R is the negative control (I0) and has a binding parameter of 0 because no YFP-fusion plasmids exhibit binding in this strain. By normalizing to a positive control and a negative control, an incorporation parameter can be determined for a YFP-fusion protein in a given strain that is relative to that protein’s incorporation in wild-type and lack of incorporation in -A-W-R. Using this quantification method, binding parameters were obtained for CheR-MT, CheW-AP, CheA-HK, and CheA-HK-P5 in the six cell strains that were mentioned earlier (Fig. 4).
Use of YFP-Fusion Proteins to Monitor or Modulate Receptor Localization and Array Formation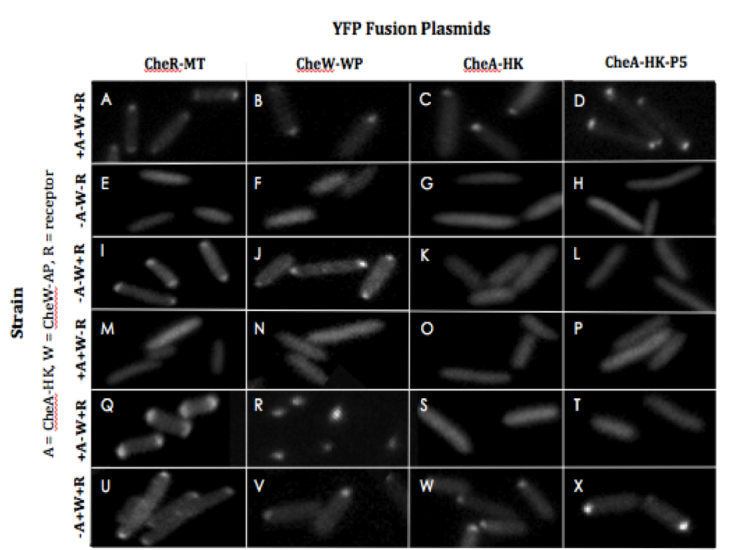
Figure 3. Use of in vivo YFP-fusion proteins to monitor and modulate localization and clustering in various cell lines. A-X. Localization of YFP-CheR-MT (pDK20; A, E, I, M, Q, and U), YFP-CheW-AP (pDK12; B, F, J, N, R, and V), YFP-CheA-HK (pDK28; C, G, K, O, S, and W), and YFP-CheA-HK-P5 (pDK36; D, H, L, P, T, and X) in +A+W+R (RP437; A-D), -A-W-R (uu2682; E-H), -A-W+R (uu1607; I-L), +A+W-R (uu2612; M-P), +A-W+R (uu2734; Q-T), and –A+W+R (RP9535; U-X).

Figure 4. The in vivo binding of YFP-fusion proteins to arrays in various cell lines.
A-D. Quantification of array binding and normalization to the positive control, +A+W+R (RP437), and negative control, -A-W-R (uu2682), for each YFP-fusion protein: YFP-CheR-MT (pDK20; A), YFP-CheW-AP (pDK12; B), YFP-CheA-HK (pDK28; C), and YFP-CheA-HK-P5 (pDK36; D). The pluses and minuses under each bar indicate the presence or absence, respectively, of CheA-HK, CheW-AP, and receptor in the cell line used. Error bars indicate standard error for a measurement of 45 cells in three separate experiments. Asterisks above bars indicate significant changes in array binding (p < 0.05).
YFP-CheR-MT
YFP-CheR-MT was tested in each of the six strains used in this study (+A+W+R,
-A-W-R, -A-W+R, +A+W-R, +A-W+R, and -A+W+R) in order to analyze receptor localization and clustering in cells via fluorescent microscopy as summarized in Fig. 3. YFP-CheR-MT was observed in tight clusters in wild-type cells and –A+W+R cells (Fig. 3A and U, respectively). Diffuse clusters were observed in -A-W+R cells (Fig. 3I) and +A-W+R cells (Fig. 3Q). No localization or cluster formation occurred in cells lacking receptor (Fig. 3E and M). Figure 4A quantifies the relative levels of YFP-CheR-MT incorporation into clusters. Similar array incorporation was observed in wild-type cells and -A+W+R cells. About 1.5 times as much incorporation occurred in -A-W+R cells and about 2.5 times as much incorporation occurred in +A-W+R cells in comparison to wild-type cells. No incorporation occurred in receptorless cells.
YFP-CheW-AP
YFP-CheW-AP was tested in each of the six strains used in this study (+A+W+R, -A-W-R, -A-W+R, +A+W-R, +A-W+R, and –A+W+R), and its incorporation into polar clusters was observed via fluorescent microscopy (Fig. 3). YFP-CheW-AP was observed in tight clusters in wild-type cells, –A+W+R cells, and –A-W+R cells (Fig. 3B, V, and J, respectively). Tight clusters occurred in most +A-W+R cells, but inclusion bodies occurred in a subset of +A-W+R cells (Fig. 3R). No localization or cluster formation occurred in cells lacking receptor (Fig. 3F and N). Quantitative analysis of YFP-CheW-AP incorporation into arrays showed similar incorporation parameters for wild-type cells, -A+W+R cells, and -A-W+R cells (Fig. 4B), while ~1.7 times as much incorporation occurred in +A-W+R cells. No incorporation occurred in receptorless cells.
YFP-CheA-HK
YFP-CheA-HK was tested in each of the six strains used in this study (+A+W+R, -A-W-R, -A-W+R, +A+W-R, +A-W+R, and –A+W+R), and its localization in clusters was observed via fluorescent microscopy (Fig. 3). Tight clusters were observed in wild-type cells and -A+W+R cells (Fig. 3C and W, respectively). No localization to clusters was detected in cells lacking receptor or CheW-AP (Fig. 3G, K, O, and S). Quantitative analysis of YFP-CheA-HK incorporation into arrays showed slightly more incorporation in -A+W+R cells in comparison to wild-type cells (Fig. 4C).
YFP-CheA-HK-P5
YFP-CheA-HK-P5 was tested in each of the six strains used in this study (+A+W+R, -A-W-R, -A-W+R, +A+W-R, +A-W+R, and –A+W+R), and its localization in clusters was investigated via fluorescence microscopy (Fig. 3). Like YFP-CheA-HK, tight clusters were observed in wild-type cells and –A+W+R cells (Fig. 3D and X, respectively). No localization to clusters occurred in cells lacking receptor or CheW-AP (Fig. 3H, L, P, and T). Quantitatively, YFP-CheA-HK-P5 showed similar incorporation into arrays in wild-type and
-A+W+R cells (Fig. 4C). No binding occurred in receptorless cells or cells lacking CheW-AP.
Determining the Array Binding Parameters of Mutant YFP-CheA-HK-P5 Domains
Selection of a library of tryptophan and alanine mutants for TAM-IDS analysis:
In order to test whether the CheA-HK-P5 domain possesses the normal CheW contacts observed in crystal structures of the native ring, we employed the Tryptophan and Alanine Mutagenesis to Identify Docking Sites (TAM-IDS) approach.10 The method was used to generate both a bump and a hole at the selected positions on the CheA-HK-P5 surface that contacts CheW-AP at interface 1. Trp substitutions at a critical protein-protein interface typically perturb binding and/or function, except in cases where they can rotate out of the contact region. Interfacial alanine mutations are often less perturbing, unless the native residue is essential. For the present study, four positions were selected on the surface of CheA-HK-P5 surface to target for Trp and Ala substitutions (Fig. 5A). Three of the positions (N630, V634, and L650) were predicted by the crystal-structure based threaded model to be within the packed area of CheA-HK-CheW-AP interface 1, whereas an additional position distal to the interface (I617) was selected as a negative control. The chosen mutations were introduced at each target position in the YFP-CheA-HK-P5 construct via site-directed mutagenesis.

Figure 5. Quantifying the effects of Trp and Ala mutations on the incorporation of YFP-CheA-HK-P5 into live cell arrays: in vivo TAM-IDS. A) Model of the four Trp mutations on CheA-HK-P5 selected for TAM-IDS analysis. Notably, all common conformers of N630W, V634W, and L650W are predicted to clash with the blue adaptor protein, while none of the I617W are predicted to clash. B) CheA-HK-P5 was fused to YFP and its ability to stably incorporate into the polar arrays of live cells lacking intrinsic CheA-HK was quantified by fluorescence microscopy as previously described.10 The resulting array binding parameter ranges from unity for the native incorporation exhibited by the wild-type YFP-CheA-HK-P5 domain to zero for the negative control domain YFP-CheA-HK-P2. The standard error is shown for each binding reaction, where n = 30 cells or more that were quantified in three separate experiments. Asterisks indicate statistically significant losses of array incorporation relative to YFP-CheA-HK-P5 (p < 0.05). For consistency with our other studies employing the S. typhimurium kinase in vitro, the indicated position labels are for S. typhimurium residues. The corresponding residues (italicized) on the E. coli domain employed in this in vivo experiment are: kI617 = kI600; kN630 = kN613; kV634 = kV617; kL650 = kL633. (The S. typhimurium and E. coli kinase regulatory domains are nearly identical, differing by only 8/145 residues).
Analyzing contacts between CheA-HK-P5 and CheW-AP using TAM-IDS in live cells.
The abilities of the mutant YFP-CheA-HK-P5 constructs to assemble into arrays in cells lacking endogenous CheA-HK were assessed. Using the quantitative method to evaluate array binding, the corrected array brightness of each cell in a population was first measured. Then, the corrected array brightness was averaged and normalized over the population to generate a relative binding parameter ranging from 0 to 1, where 0 corresponds to the negligible array binding of a negative control (YFP-CheA-HK-P2 domain), while 1 represents the normal level of binding seen for the wild-type YFP-CheA-HK-P5 domain (see Determining the Array Binding Parameters for YFP-Fusion Proteins for a more detailed version of the quantitative method).
Figure 5B shows the in vivo array binding parameter for the Ala and Trp mutants at each of the selected positions. The introduction of Trp substitutions at each of the three crystallographic interface 1 positions (N630W, V634W, L650W) greatly reduced stable array incorporation of the YFP-CheA-HK-P5 domain, a result consistent with the idea that the isolated, monomeric P5 domain forms the same CheW-AP contacts previously observed for dimeric CheA-HK in structural studies of the CheA-HK-P5-CheW-AP ring. Bulky Trp substitutions at these positions would be expected to disrupt the packing interactions required for normal interface 1 assembly, resulting in the observed loss of incorporation. Both Trp and Ala substitutions at position L650 caused virtually total loss of cluster incorporation, indicating that the native Leu side chain is essential for interface 1 assembly, tolerating neither bulky substitution nor truncation. By contrast, Trp and Ala substitutions at control residue I617 had considerably smaller effects on cluster incorporation, as expected due to its location largely outside the packing region of the crystallographic interface. Andrew Natale of the Falke lab observed that the same three Trp substitutions positions (N630W, V634W, L650W) that disrupt YFP-CheA-HK-P5 binding to clusters in vivo also inhibit the binding of full-length CheA-HK to arrays in vitro, although the inhibition is smaller due to the multiple interactions of dimeric CheA-HK with the lattice.1
Discussion
YFP-CheR-MT
YFP-CheR-MT localization to polar clusters in the different cell backgrounds was similar to the results of previous studies in the Sourjik lab,3 although those studies used a smaller set of test strains. Like the previous experiments, YFP-CheR-MT did not bind in receptorless strains, formed tight clusters in the strain with CheA-HK and CheW-AP, and formed diffuse, cap-like clusters in the strain lacking CheA-HK and CheW-AP. Because CheR-MT always binds to receptor when it is present, the absence of clusters in strains lacking receptor was not surprising. The tight clusters in the strain containing both CheA-HK and CheW-AP indicated that arrays were forming. For the strain lacking CheA-HK and CheW-AP, the results indicated that receptors were still localized at the cell poles, but arrays were not forming, since the clusters were diffuse. Together these findings confirmed that CheA-HK and CheW-AP were able to stabilize the array, as they do in the native lattice architecture, yielding tight, polar clusters in live cells.
YFP-CheR-MT was also examined in a strain lacking only CheA-HK and in a strain lacking only CheW-AP. Previous studies have not examined either of these cell backgrounds for YFP-CheR-MT. YFP-CheR-MT was observed in tight clusters in a strain containing CheW-AP but lacking CheA-HK, indicating that CheW-AP alone can stabilize receptor arrays in the absence of CheA-HK. However, in a strain containing CheA-HK but lacking CheW-AP, diffuse, polar caps were observed, indicating that YFP-CheR-MT was localizing and binding to receptors in the cell, but no arrays were forming in the absence of CheW-AP. This suggests that full-length CheA-HK requires the presence of CheW-AP to form the array, which is in agreement with prior findings.11,7,3
YFP-CheW-AP
Like the Sourjik lab’s studies with YFP-CheW-AP, tight clusters formed in wild-type cells and in cells lacking both CheA-HK and CheW-AP. These results indicate that YFP-CheW-AP is able to incorporate into fully formed arrays in wild-type cells, and that YFP-CheW-AP alone is sufficient to stabilize an array-like distribution of receptors. The latter is an interesting finding, because it suggests that CheW-AP molecules can fill in where CheA-HK is absent in the interconnecting rings, presumably yielding the native hexagonal array of receptor oligomers within the tight cluster.
YFP-CheW-AP was also examined in receptorless strains, a strain lacking CheA-HK, and a strain lacking CheW-AP. Previous studies have not examined the two latter experimental conditions for YFP-CheW-AP. As expected, YFP-CheW-AP did not bind in receptorless strains but did form tight receptor clusters containing only CheW-AP, providing further evidence that CheW-AP is able to stabilize the array structure when CheA-HK is absent. Interestingly, in a strain lacking CheW-AP, YFP-CheW-AP appears to be capable of forming an array-like structure with CheA-HK in most cells, but in some cells the presence of bright caps suggests that arrays are not forming. Perhaps the steric hindrance of the YFP tag on the CheW-AP fusion protein can sometimes complicate its incorporation between full-length CheA-HK proteins to link the individual core complexes into an array.
YFP-CheA-HK
Similar to the Sourjik lab’s results with YFP-CheA-HK, tight clusters were observed in wild-type cells and no cluster formation was detected in cells lacking both CheA-HK and CheW-AP. The tight clusters in wild-type cells indicate that YFP-CheA-HK is able to incorporate into native arrays as expected. Since no clusters were observed in the strain lacking both CheA-HK and CheW-AP, it follows that YFP-CheA-HK requires CheW-AP to form native receptor clusters.11,7,3
YFP-CheA-HK was also examined in receptorless strains, a strain lacking CheA-HK, and a strain lacking CheW-AP. YFP-CheA-HK did not bind in receptorless strains and formed tight clusters in the strain lacking CheA-HK. This suggests that CheW-AP is able to form an array with YFP-CheA-HK in the absence of endogenous CheA-HK. No localization to clusters was detected in the strain lacking CheW-AP, echoing earlier findings in this study and prior studies that CheA-HK requires CheW-AP to form clusters.
YFP-CheA-HK-P5
Similar to the Sourjik lab’s experiments with YFP-CheA-HK-P5, tight clusters were observed in wild-type cells, indicating that YFP-CheA-HK-P5 was incorporating into arrays with CheA-HK, CheW-AP, and receptor. However, in the present study no incorporation into polar clusters was detected in cells lacking both CheA-HK and CheW-AP, which is in contrast to the Sourjik lab’s report of tight clusters in this strain.
YFP-CheA-HK-P5 was also examined in receptorless strains, a strain lacking CheA-HK, and a strain lacking CheW-AP, which previous studies have not done. Herein, localization to clusters did not occur in the receptorless strains or in any strain lacking CheW-AP. Tight clusters occurred in the strain lacking CheA-HK but containing CheW-AP. These are the same results that were obtained for YFP-CheA-HK in the corresponding strains.
Overall, the present results for incorporation of the YFP-CheA-HK-P5 domain into tight clusters show the same requirements for receptor and CheW-AP that were observed for full-length YFP-CheA-HK. It follows that the isolated P5 domain possesses all of the CheA-HK surfaces essential for the receptor and CheW-AP contacts needed for tight cluster formation. Moreover, when one of these contacts (CheA-HK-P5-CheW-AP ring interface 1) was perturbed by bulky Trp mutations, cluster formation was disrupted as predicted by the known crystal structure of the contact, providing strong evidence that our YFP-CheA-HK-P5 domain incorporates properly into the CheA-HK-P5-CheW-AP ring. It is curious that in the Sourjik study the YFP-CheA-HK-P5 domain (but not full-length YFP-CheA-HK) was found to lack the CheW-AP requirement for tight cluster formation. There are at least three possibilities for this discrepancy:
a) The Sourjik lab’s strain that lacks both CheA-HK and CheW-AP also lacks CheB, CheR-MT, CheY, CheZ, Tar, and Tap. The Falke Lab’s strain that lacks both CheA-HK and CheW-AP contains CheB, CheR-MT, CheY, CheZ, Tar, and Tap. It seems unlikely that these strain differences would eliminate the CheW-AP requirement, but repeating the experiment with YFP-CheA-P5 in the identical strain used in the Sourjik lab and in the Falke lab strain, side by side, could test this possibility.
b) The Sourjik lab’s YFP-CheA-HK-P5 plasmid may not contain the entire N-terminus of the P5 domain. The residue range reported in the Sourjik paper for the P5 domain in the YFP-CheA-HK-P5 construct is shorter than the range defined by the known crystal structure of the domain. The YFP-CheA-HK-P5 construct used in the present study includes the entire P5 domain. A shortened P5 domain may produce different results from the full sequence. Obtaining the Sourjik plasmid and sequencing it could test this possibility.
c) The Sourjik lab may have utilized the incorrect YFP-CheA-P5 fusion plasmid. Their findings suggest the possibility that the construct contained CheW-AP rather than P5. The fusion plasmid used in this study has been sequenced and verified as the P5 domain of CheA-HK. Obtaining the Sourjik plasmid and sequencing it could test this possibility.
Conclusions
Experiments that were performed in this study and previous studies yielded the same results,11,7,3 except that YFP-CheA-HK-P5, in the strain lacking both CheA-HK and CheW-AP, was observed to form tight clusters in the previous work but in the present study did not exhibit detectable cluster incorporation. New experimental conditions for observing the effects of YFP-fusion proteins on localization and array formation included the testing of YFP-CheR-MT in -A+W+R and +A-W+R, YFP-CheW-AP in –A+W+R, +A-W+R, and receptorless strains, YFP-CheA-HK in -A+W+R, +A-W+R, and receptorless strains, and YFP-CheA-HK-P5 in –A+W+R, +A-W+R, and receptorless strains. The results indicate that receptor must be present in the strain in order for clusters to form, CheA-HK or CheA-HK-P5 cannot localize to clusters without CheW-AP present, while CheW-AP can localize to and stabilize tight clusters in the absence of CheA-HK.
Overall, the results strongly suggest that the CheA-HK-P5 domain possesses the full complement of CheA-HK interaction surfaces necessary to form hexagonal rings with receptor and CheW-AP. However, while CheW-AP alone can stabilize tight receptor clusters, CheA-HK-P5 requires assistance from CheW-AP and cannot stabilize tight clusters in the absence of CheW-AP. Mutagenesis analysis indicates that bulky Trp substitutions on the surface of CheA-HK-P5 known to contact CheW-AP in crystal structures of the CheA-HK-CheW-AP hexagonal ring disrupt CheA-HK-P5 incorporation, suggesting that CheA-HK-P5 forms a hexagonal ring with receptor and CheW-AP even in the absence of the other CheA-HK domains. Together, the findings are consistent with a simple model in which the formation of a hexagonal ring of alternating CheA-HK-P5 and CheW-AP molecules, or a hexagonal ring of CheW-AP alone, is sufficient to organize receptor oligomers into a hexagonal lattice, yielding the tight clusters observed in fluorescence microscopy. Collaborative cryo-EM studies with the Jensen lab at Caltech will be designed in the future to test this hypothesis.
References
1. Natale, A.M., Duplantis, J.L., Piasta, K.N., and Falke, J.J. (2013) Structure, function, and on-off switching of a core unit contact between CheA kinase and CheW adaptor protein in the bacterial chemosensory array: A disulfide mapping and mutagenesis study. Biochemistry 52: 7753-7765.
2. Li, M., and Hazelbauer, G.L. (2004) Cellular stoichiometry of the components of the chemotaxis signaling complex. J Bacteriol 186: 3687-3694
3. Kentner, D., Thiem, S., Hildenbeutel, M., and Sourjik, V. (2006) Determinants of chemoreceptor cluster formation in Escherichia coli. Mol Microbiol 61: 407-417.
4. Bilwes, A.M., Alex, L.A., Crane, B.R., and Simon, M.I. (1999) Structure of CheA, a signal-tranducing histidine kinase. Cell 96:131-141.
5. Kentner, D., and Sourjik, V. (2006) Spatial organization of the bacterial chemotaxis system. Curr Opin Microbiol 9: 619-624.
6. Hazelbauer, G.L., Falke, J.J., and Parkinson, J.S. (2008) Bacterial chemoreceptors: high-performance signaling in networked arrays. Trends Biochem Sci 33: 9-19.
7. Sourjik, V., and Berg, H.C. (2000) Localization of components of the chemotaxis machinery of Escherichia coli using fluorescent protein fusions. Mol Microbiol 37: 740-751.
8. Kim, K.K., Yokota, H., and Kim, S.H. (1999) Four-helical-bundle structure of the cytoplasmic domain of a serine chemotaxis receptor. Nature 400: 787-792.
9. Miller, A.S., Kohout, S.C., Gilman, K.A., and Falke, J.J. (2006) CheA kinase of bacterial chemotaxis: chemical mapping of four essential docking sites. Biochemistry 45: 8699-8711.
10. Piasta, K.N., Ulliman, C.J., Slivka, P.F., Crane, B.R., and Falke, J.J. (2013) Defining a key receptor-cheA kinase contact and elucidating its function in the membrane-bound bacterial chemosensory array: a disulfide mapping and TAM-IDS study. Biochemistry 52: 3866-3880.
11. Parkinson, J.S., Ames, P., and Studdert, C.A. (2005) Collaborative signaling by bacterial chemoreceptors. Curr Opin Microbiol 8: 116-121.
12. Studdert, C.A., and Parkinson, J.S. (2005) Insights into the organization and dynamics of bacterial chemoreceptor clusters through in vivo crosslinking studies. Proc Natl Acad Sci USA 102: 15623-15628.
13. Shimizu, T.S., Le Novere, N., Levin, M.D., Beavil, A.J., Sutton, B.J., and Bray, D. (2000) Molecular model of a lattice of signaling proteins involved in bacterial chemotaxis. Nat Cell Biol 2: 792-796.
14. Parkinson, J.S., and Houts, S.E. (1982) Isolation and behavior of Escherichia coli deletion mutants lacking chemotaxis functions. J Bacteriol 151: 106-113.
15. Amann, E., Ochs, B., and Abel, K.J. (1988) Tightly regulated tac promoter vectors useful for the expression of unfused and fused proteins in Escherichia coli. Gene 69: 301-315.
16. Vogel, H.J., and Bonner, D.M. (1956) Acetylornithinase of Escherichia coli: partial purification and some properties. J Biol Chem. 218: 97-106.
17. Weis, R.M., and Koshland, D.E., Jr. (1988) Reversible receptor methylation is essential for normal chemotaxis of Escherichia coli in gradients of aspartic acid. Proc Natl Acad Sci USA 85: 83-87.
18. Winston, S.E., Mehan, R., and Falke, J.J. (2005) Evidence that the adaptation region of the aspartate receptor is a dynamic four-helix bundle: cysteine and disulfide scanning studies. Biochemistry 44: 12655-12666.
19. Kenter, D., and Sourjik, V., (2009) Dynamic map of protein interactions in the Escherichia coli chemotaxis pathway. EMBO 5: 238
Host-Parasite Interactions: The Cuckoo Catfish and Non-Sympatric Hosts, Anna C. Vinton
Table of Contents
Abstract……………………………………………………………………………...4
Introduction……………………………………………………………………….4-6
Objectives and Significance……………………………...………………………6-7
Background
Cichlid Fish of the Great Lakes in the East African Rift Valley………...………….8
Lake Tanganyika …………………………………………………….………8-9
Lake Malawi........................................................................................................9
Conservation Concerns……………………………………………………..10-11
Maylandia estherae (red zebra) and Maylandia zebra (albino zebra)………..….11-13
Ctenochromis horei…………………………………………………………….13
Synodontis multipunctatus (cuckoo catfish), a brood parasite……………………..14
Methods
Rate of parasitism…………………………………………………..………….15
Courtship behavior observations……………………………………………15-16
Visual documentation of early development…………………………………16-17
Statistical Analysis…………………………………………………………17-18
Results
Red Zebra Length and brood size………………………………………………18
Rate of Parasitism……………………………………………………………..18
Courtship Observations…………………………………………………….18-19
Developmental Staging…………………………………………………………19
Cuckoo Catfish Host Preference………………………………………………..20
Discussion
Red Zebra Length and Brood Size………………………………………..…20-21
Parasitism Avoidance Strategies………………………………………….…….21
Red Zebra Rate of Parasitism and Comparison with other Host Species………21-22
Parasitism of the Red Zebra vs. Albino Zebra………………………………..22-23
Early Developmental Stages……………………………………………………23
Courtship Observations…………………………………………………..…...23
Cuckoo Catfish Host Preferences........................................................................24
Conclusion……………………………………………………………………...24-25
Acknowledgements………………………………………………………………..25
References………………………………………………………………………26-33
Figures and Tables……………………………………………………………..34-44
Abstract
The cuckoo catfish (Synodontis multipunctatus)), from Lake Tanganyika in Africa, parasitizes mouth-brooding cichlid fishes (catfish eggs get picked up and incubated in the mouths of cichlid females, where the catfish young feed on cichlid eggs). I examined the impact of parasitism by the cuckoo catfish on an allopatric (not naturally co-occurring) mouthbrooding cichlid, the red zebra (Maylandia estherae) relative to that of a previously characterized sympatric (naturally co-occurring with the parasite) host species (Ctenochromis horei). The red zebra was parasitized significantly more than the sympatric C. horei, which suggests that the sympatric host has evolved strategies to minimize cuckoo catfish parasitism. Early development of the red zebra did not differ significantly from that of the C. horei, indicating no early developmental adaptations to deter the catfish young from eating the host young. While the courtship behaviors of C. horei were also similar to that of the red zebra, C. horei was clearly more aggressive, which may be an adaptation to avoid brood parasitism. I also examined levels of parasitism between the red zebra and a closely related, also sympatric, albino zebra cichlid (Maylandia zebra). Due possibly to its lower visual acuity, the albino zebra morph was parasitized significantly more than the red zebra. Lastly, the catfish was not found to parasitize hosts at random but to prefer to parasitize female cichlids of an intermediate size.
Introduction
Obligate brood parasitism (the use of hosts for providing care to the parasitic progeny) has great evolutionary and ecological significance. Because of the close interactions between parasite and host, brood parasitism can reveal much about co-evolutionary mechanisms (Soler et al. 2000, Cichon 1996, Rothstein 1990). These mechanisms underlie adaptations that increase the success of the parasite, as well as host adaptations to avoid brood parasitism. It was initially thought that such brood parasitic interactions occurred only in birds and insects (Sato 1986, Fanelli et al. 2005). However, Sato (1986) found that the cuckoo catfish (Synodontis multipunctatus) from Lake Tanganyika in East Africa parasitizes mouth-brooding cichlid fishes by leaving their newly laid eggs in the cavity of the cichlid’s mouth. African cichlids are well known in evolutionary biology due to their adaptive capabilities. They vary in color, morphology, eating habits, and much more in order to fill the numerous niches available in the East African great lakes. Because African cichlids are model organisms to study adaptive radiation, their responses to brood parasites provide insight into the mechanisms underlying their abilities to develop defenses against parasitism.
In order for the cuckoo catfish to parasitize a cichlid brood, it must spawn in synchrony with the cichlids. Catfish eggs are laid for the cichlid to pick up along with their own eggs. The catfish eggs are thus mouth-brooded together with the host eggs, but hatch earlier and feed upon the developing larvae of the cichlid host. The fry (young) of the parasitic catfish not only depend upon the host for protection, but also exploit parental investment of the host (i.e., receive nutrients from the parent host by feeding on the host’s own fry). The feeding on cichlid fry by the catfish leaves few or no surviving cichlid offspring. Cruz et al. (2004) found that, under laboratory conditions, the catfish can also parasitize cichlids from Lake Victoria and Lake Malawi, which are hosts that do not naturally co-occur with the cuckoo catfish. This finding is important as it provides a system for studying parasitism in a laboratory, where questions can be rigorously addressed. Since natural selection (causing traits to become more or less common in a population) acts on the breeding biology of these fishes, factors affecting development of host-parasite interactions can be studied as a model system in evolutionary, behavioral, and developmental biology. Through studying this unique interaction, we can also observe to what extent the cuckoo catfish can parasitize a new host with which it has not coevolved by examining its reproductive success. The study of the interaction between such a naïve host (red zebra) and the parasitic cuckoo catfish provides insight into the adaptive capabilities of the red zebra, i.e., whether or not the red zebra reacts to being parasitized. These results will allow inferences to be made about what behaviors may be established in order to defend against brood parasitism.
Objectives and Significance
The objectives of my study are:
(1) To characterize the breeding biology of the red zebra in order to better understand the interaction between the brood parasitic catfish and naïve cichlid hosts. This study provides insight into the early developmental biology of the red zebra, as well as the courtship behaviors of the spawning cichlids. The courtship behaviors and early developmental biology were compared to other mouthbrooding cichlids that did (Ctenochromis horei) and did not (Maylandia zebra) coevolve with the parasitic catfish to see if there are any differences. My null hypothesis was that the courtship and early development of the red zebra did not clearly differ from that of the sympatric Ctenochromis horei.
(2) To better understand the non-sympatric host (red zebra) relationship with the parasitic cuckoo catfish, and experimentally compare the rates of parasitism of the red zebra versus species that coevolved with the cuckoo catfish under laboratory conditions (Ctenochromis horei – A. Cruz, M. Cohen, Cruz lab unpublished data). My study investigates the interaction of the cuckoo catfish with a naïve host. No prior study has investigated this brood parasite-naïve host interaction in fish. Studies of the interaction of avian brood parasites with naïve hosts (Rothstein 1990, Soler 2000, Cruz et al. 2008) have shown that avian brood parasites were able to parasitize naïve hosts, and some of the naïve host populations were able to develop the ability to distinguish their own eggs from foreign eggs, exhibiting parasite-egg rejection behavior. Therefore, an objective of the present study is to increase our understanding of the naïve host and parasite relationship between cichlids and the cuckoo catfish. Reproductive success of each species is measured by the number of young each host female incubates in her mouth. The null hypothesis was that the rate of parasitism of the red zebra did not significantly differ from that of the sympatric C. horei.
(3) To compare the rates of parasitism between the red zebra and the albino zebra. This study compares the response and susceptibility to parasitism of a wild-type line of a non-sympatric host (red zebra, M. estherae) and a mutant morph (albino zebra, M. zebra) particularly to determine if vision is an important factor for successful parasitism avoidance. How eyesight plays a role in the success of the parasitic catfish has not yet been investigated in the literature. The null hypothesis was that the rate of parasitism of the red zebra did not significantly differ from that of the albino zebra.
(4) To gain understanding about how the cuckoo catfish chooses its hosts by investigating what class sizes of cichlids are parasitized. For instance, does cuckoo catfish parasitizes spawning mouth-brooding cichlids at random? Because parasites have close relationships with their host species, it is possible for the parasite to be selected by evolution to specialize on one, or a few, host species. Among insects, only one paper wasp has been found to parasitize as many as four host species (Fanelli et al. 2005). But, like many avian brood parasites (Rothstein 1990, Soler 2000, Cruz et al. 2008), the cuckoo catfish can parasitize many hosts. Studying the behaviors that allow the cuckoo catfish to parasitize so many hosts can give us insight into what makes brood parasites so successful. The null hypothesis was that the cuckoo catfish parasitized cichlid hosts randomly, with no host size preference.
Background
Cichlid Fish of the Great Lakes in the East African Rift Valley
The subjects of this study are native to the East African Great Lakes, located in the African Rift Valley. The African Rift Valley consists of a geographic rift in Eastern Africa that is over 4,828 kilometers long, and was formed about 25 million years ago when Africa and Eurasia collided (Roberts et al. 2012). A rift is a fracture in the earth's surface that widens over time. The oldest rift in this valley (Ethiopian Rift) occurs in the Afar region of Ethiopia (Roberts et al. 2012). South of this is a series of rifts that include the Western branch or the "Albertine Rift" which contains the East African Great Lakes (Figure 1) (Plumptre 2007).
The cichlid fishes of the East African Great Lakes are a widely used source of study for adaptive radiation and sympatric speciation (Lowe-Mcconnell 2003, Allender et al. 2003, Genner et al. 2005). The East African Great Lakes differ in age, which allows different stages of adaptive radiation of the cichlid fish to be studied at the same time (Sturmbauer 1998). These lakes include Lake Malawi, where the red zebra cichlid and albino zebra cichlid are native, Lake Tanganyika where the cuckoo catfish and C. horei are native, and Lake Victoria.
Lake Tanganyika
Lake Tanganyika is the oldest of the three East African Great Lakes as it was formed 9nine to twelve million years ago (Sturmbauer et al. 2001). It is divided between Tanzania, the Democratic Republic of the Congo, Burundi, and Zambia (Figure 1). Likely because of its great age, the cichlid species of Lake Tanganyika are more diverse morphologically and behaviorally than the cichlids in the other two great lakes (Fryer and Iles 1972). There are about 23 species of cichlids in the lake (Konings 1998). Although there are fewer endemic cichlid species in Lake Tanganyika than in Lake Malawi and Lake Victoria, the former lake’s species are more genetically distinct from each other, making them better suited for phylogenetic studies (Meyer et al. 1990). Due to lake level fluctuations, Lake Tanganyika was once composed of three smaller bodies of water (Sturmbauer et al. 2001). The separating and coming together of the bodies of water presumably favored allopatric speciation of the cichlid fish that inhabit the lake (Sturmbauer and Meyer 1992, Verheyen et al. 1996).
Lake Malawi
Lake Malawi (Lake Nyasa) is located between Malawi, Tanzania, and Mozambique (Figures 1 and 2). It is the ninth largest lake in the world, approximately 13974 square kilometers, 701 meters deep, and home to over 500 species of cichlids that presumably evolved from a few common ancestors within the past million years (Albertson et al. 1999). This rapid diversification has been the subject of studies of speciation, morphological adaptation, sexual selection and breeding behavior (Kornfield et al. 2000, Allender 2003, Kocher 1993). The pH of Lake Malawi ranges from 7.7-8.5 with the variation caused by the level of carbon dioxide dissolved in the water (Muller et al. 1973). In areas where the water is more turbulent, the pH is more basic, while in calmer waters the pH is lower. In the more turbulent areas, the water is more aerated, and in the calm areas of the lake, there is a higher level of dissolved carbon dioxide. About one third of the coast of Lake Malawi is rocky, and the shoreline is where rock-dwelling cichlids (mbuna) live, including the red zebra and albino zebra (Lowe-Mcconnell 1993).
Conservation Concerns
The Rift Valley cichlids are under tremendous human pressure and many species are vulnerable to extinction (Odada et al. 2003). The rock-dwelling cichlids of Lake Malawi (mbuna), which includes the red and albino zebras, are endemic (not found elsewhere) and localized in distribution, some of which only live in a single confined rock group (Genner 2005, Stauffer et al. 1997). This makes the risk of extinction of these cichlids greater than that of more widely distributed species (Stauffer et. al, 1997).
The mbuna include many species with limited ranges and habitats. They also do not have a pelagic dispersal phase, have slow growth rates, and low fecundity (Genner 2005). Because of these traits, the mbuna are especially vulnerable to species loss. There are some no-fishing zones within Lake Malawi, but overfishing may remain a serious threat to some fish species. Although, according to Genner et al. (2005), the mbuna are not under a direct threat from overfishing due to their lack of a commercial value. To date, scientists have not found any introductions of invasive species into Lake Malawi (unlike that of Lake Victoria). However, a potential threat may be posed by the aquarium trade (Ribbink et al. 1983). Due to this trade, introduced species have been added to the lake, and although they have not been found to compete with the native mbuna, there have been instances of hybridization (Stauffer et al. 1996). Although scientists agree that the most significant threat to the mbuna stems from habitat modification due to pollution, little is still known about the effects of the changes related to pollution. Because both Lake Tanganyika and Lake Malawi all have long flushing times becausedue to their large volumes and small outflow, pollution retention could be a serious threat. Genner et al. (2005) suggests a conservation focus on specific taxa rather than attempting to conserve the mbuna as a whole. To conserve species in general, knowledge about their breeding biology is vital. This knowledge about the breeding biology is valuable in large part because of the conservation concerns posed in their native habitat (Lake Malawi). More specifically, this information can be applied to implement habitat rehabilitation or creation using knowledge about optimum breeding environments.
Maylandia estherae (Red Zebra) and Maylandia zebra (Albino Zebra)
The rocky shoreline of Lake Malawi is inhabited by the mbuna, which is made up of 200 species. The establishment of some species of mbuna presumably occured within the last 200-300 years (Owen et al., 1990). Maylandia is a genus of mbuna cichlids endemic to (only found in) Lake Malawi (Stauffer et al. 1997, Oliver, 2009). Although it was previously proposed that these cichlids speciated from a single ancestor (Kocher et al. 1993, Moran et al. 1994), recent studies show that these populations arose as a hybrid population from at least two different Haplochromine (dominant cichlid group in East Africa comprised of the genus Haplochromis and other closely related genera) ancestors (Joyce et al., 2011). It is hypothesized that the common ancestor is a riverine generalist closely related to Lake Tanganyika’s haplochromine tribe 700,000 years ago (Kocher et al. 2001). The exact drivers of cichlid speciation are unknown, but it is suggested (Genner and Turner 2005) that either allopatric or sympatric speciation was involved. Allopatric speciation is hypothesized to have occurred due to fluctuations in the lake level (Owen et al. 1990) that can cause temporary formation of smaller water bodies, causing fish populations to become geographically isolated, and subsequent rejoining with the larger body of water, causing fish populations to become reunited. Sympatric speciation may have been driven by “intrinsic isolating mechanisms” (mechanisms with a genetic basis, e.g., behavioral post-mating isolations) (Genner and Turner 2005). However, researchers speculate that, in view of the relatively young age of the mbuna (0.3-0.5 million years (Genner et al. 2007)), a fast-acting form of species divergence must have occurred in Lake Malawi. Speciation by sexual selection has been suggested as the mechanism (Albertson et al. 1999) by which variation in male breeding coloration led to rapid evolution of haplochromine cichlids (Kidd et al. 2006). Coloration and breeding behavior may thus separate closely related species by causing them not to breed (Stauffer et al. 1997). Due to this hypothesis, differences in coloration have recently been used to identify species; coloration may be vital in mate recognition and may act as a prezygotic barrier to gene flow (Konings 2007). That is, the mating pair must be a specific color for mating, and ultimately gene transfer to occur.
One of the subjects of the present study is Maylandia estherae, the red zebra. The red zebra is typically solid orange and sexually dimorphic. Males of this species, like many cichlid species, are highly territorial (Amorim et al. 2008). There are 40-50 species in the genus Maylandia (Ciccotto 2008, Stauffer et al. 2013). The species in the genus are relatively small (less than 25 cm) in length, are brightly colored and often strongly sexually dimorphic (phenotypic differences between males and females are present) and all members of this genus exhibit mouthbrooding (Konings 2001). Mouthbrooding is a mechanism whereby one (or both) of the parents carries the eggs and fry in the mouth (Barlow 2000), although most cichlid mouthbrooders are maternal (including the subjects of this study) (Kuwamura 1986). The offspring develop using their yolk sac as a nutrition source and use the parent’s mouth for protection as young juveniles, before becoming independent and leaving the mouth, large enough to survive on their own (Genner et al. 2005).
The albino zebra, an albino morph of zebra cichlid, is similar to the red zebra and was once considered the same species. Like the red zebra, the Albino zebra is also a maternal mouthbrooder. Maylandia is one of the most species rich genera of the Lake Malawi mbuna (Knight and Turner 2004). Currently Maylandia (formerly Pseudotropheus) is comprised of 13 described species, with 20 species recognized by aquarists but not formally described (Konings 1990). Eyesight in albino organisms relative to wild organisms is well documented. Lack of pigment in the eyes of albino morph cause reduced visual acuity (Lashley 1930, Wilson et al. 1988, Abadi and Pascal 1991, Ren et al. 2002). Because visual aspects, including the ability to see color, has been shown to be important in cichlid mating (Seehausen and van Alphen 1998), having reduced visual capabilities may impact the breeding success of a species. The present study poses the question of whether or not reduced visual capabilities increase the rate of brood parasitism by the cuckoo catfish on a cichlid host.
Ctenochromis horei
In this study C. horei is used as a model for cichlids that coevolved with the cuckoo catfish. Native to the shallow (1m-4m) (Sefc et al. 2009) vegetated zone of Lake Tanganyika, like the red and albino zebras, C. horei is a haplochromine cichlid. C. horei, like the other species in this study, is a sexually dimorphic, maternal mouthbrooder (Ochi 1993).), and is a carnivorous (Taborsky and Foerster 2004) feeding predominantly on fish. In the wild, C. horei establish a strict hierarchy between the males, the largest and most colorful usually the most dominant (Ochi 1993). Unlike other mouthbrooding cichlids, C. horei mates by defending a group of females, meanwhich means that reproductive success is dependent on male to male combat as opposed to female mate choice (Reichard et al. 2007).
Synodontis multipunctatus (Cuckoo Catfish), a Brood Parasite
Brood parasitism (use of hosts for providing care to parasitic progeny) evolved in insects, birds, and fish (Soler et al. 2000, Cichon 1996, Rothstein 1990). Recent studies documented the presence in Lake Tanganyika of an obligate brood parasite, the cuckoo catfish (Synodontis multipunctatus) that uses mouthbrooding cichlids as hosts (Sato 1986, Cruz 2004). Prior to the discovery of obligate brood parasitism in the cuckoo catfish, it was thought that this form of social parasitism occurred only in birds and insects.
As an obligate brood parasite, the cuckoo catfish can only reproduce by prompting a mouthbrooding cichlid host to take care of its young. During cichlid spawning, the cuckoo catfish enters the spawning area of the cichlids and breeds simultaneously. With each successive intrusion into the breeding area, the catfish lay and fertilize their eggs while eating some host eggs. Concurrently, the female cichlid inadvertently picks up some of the catfish eggs along with its own, even though the catfish eggs are of different size and color. Eggs of the catfish are then incubated in the mouth of the host species together with host eggs. Catfish eggs hatch earlier than those of the host cichlid. Following absorption of their yolk sac, the catfish fry feed upon the host fry while still in the cichlid’s mouth, and consequently take advantage of the complete maternal effort (Cruz et al. 2004). Early stages of this catfish are therefore dependent on the host for food and protection. When parasitized, the host cichlid is left with few to no young as the catfish young eat them.
Methods
Rate of Parasitism
Experimental aquaria used ranged in size from 110 to 568 liters, and contained breeding groups of red zebra cichlids and cuckoo catfish in ratios of about 3:1 female to male cichlids and 1:1 female to male catfish. The fish I used in this study were located in the Cruz lab in the University of Colorado at Boulder. In this lab, the tanks are kept at a consistent temperature of 24-26° C. Tanks were also buffered in order to maintain a pH close to 8.5, which is close to that of the pH in the East African Great Lakes. I placed flowerpots inside the tanks to serve as breeding territories for the male red zebras; this is where spawning occurred.
I monitored tanks daily for female cichlids carrying embryos, as evidenced by distended buccal (oral) cavities. Following identification, I carefully removed these females from the tank and recorded the standard length of the female cichlid. Then, I obtained the embryos by gently holding the female’s mouth open in a small volume of tank water and squirting water into the oral cavity to dislodge the eggs from the mouth. I then recorded the number of cichlid eggs and catfish eggs that were present. I put these embryos into incubation chambers during early development for observation, in order to compare the early development of the red zebra to that of other cichlids.
Courtship Behavior Observations
I examined the courtship behavior of the red zebra in order to compare it to that of the sympatric species (C. horei). I wanted to examine not only whether or not there was a spawning and courtship difference between sympatric and non-sympatric species to the cuckoo catfish, but also whether or not there were varying levels of aggression shown towards the parasitic catfish. I filmed red zebras during breeding to observe courtship behaviors and compared this information to standardized rock-dwelling cichlid courtship specified in Seehausen (1996). In general, after acquiring a territory, the male cichlid displays (with all fins erect) to a female, thereby initiating spawning. When the female and male are ready to spawn, the female stays in the male’s territory. During breeding, the male quivers his anal fin, where eggs spots are located. These eggs spots on the anal fin of the male serve as dummy eggs to distract the female long enough for the male to fertilize her eggs. The female releases the eggs and the male releases sperm, which is then ingested and fertilizes the eggs she picks up into her mouth (Figure 3).
Visual Documentation of Early Development
In this study, I documented the early development of the Red Zebra in order to compare the developmental timing with that of the parasitic catfish, and a sympatric species to the catfish. With many brood parasites in the population, it could be beneficial to the host to develop faster, in order to reduce the amount of host progeny that the catfish young are able to consume. I wanted to test the hypothesis that the red zebra development is not slower than that of the C. horei (the species that coevolved with the cuckoo catfish) even with the lack of pressures caused by brood parasitism. I put the broods that I stripped from the holding females into incubation chambers. These incubation chambers were tubes I placed in the tank that allowed airflow to tumble the developing embryos. I took pictures of the early developmental stages of the broods (of each of the young daily for 23 days) using a Carl Zeiss Stem SV II. The microscope was connected to a Carl Ziess AxioCam HRc camera and AxioVision Rev. 4.6.3 software. Using the program AxioVision, I viewed images of the developing Maylandia estherae.
Statistical Analysis
Red Zebra Length and Brood Size
In order to analyze whether body size is linearly related to brood size, I used a Pearson’s product-moment correlation test, followed by a regression analysis on brood size and body size.
Parasitism Rate
I calculated the percent parasitism of the red zebra broods by looking at how many of the total broods of red zebra were successfully parasitized. For every brood that is parasitized, most to all of the red zebra young are eaten by the parasitic catfish young.
Cuckoo Catfish Host Preference
I created a general linear model for whether the cichlid that was parasitized could be predicted by size, and another to see if it could be predicted by brood size. I used ANCOVA after verifying a normal distribution of the data.
To test whether cichlid size distribution differed for parasitized and unparasitized cichlids, I used the two-sample Kolmogorov test. I then calculated the variance of the sizes of cichlids that were parasitized to compare to the variance of the sizes of cichlids that were not parasitized. The tested question; is the variance of parasitized cichlids sizes equal to the variance of unparasitized cichlids sizes.? I began to analyze this using the F-test of equal variances. To test this significance further I used a Fligner-Killeen test of homogeneity of variances.
Results
Red Zebra Length and Brood Size
During the course of the study, I examined 101 unparasitized broods of red zebra. Female cichlid body length ranged from 60 mm to 90 mm, and brood size varied from 8 to 60 red zebra eggs. From the regression analysis and the Pearson’s product-moment correlation test on body length and brood size I received a p-value of p<0.01, and r=0.46 (Figure 4). This indicates a significant positive relationship between cichlid body size and brood size.
Rate of Parasitism
Of the 136 broods of red zebra, 35 were parasitized by the cuckoo catfish, resulting in a rate of parasitism (parasitized/total broods) of the red zebra by the cuckoo catfish of 25.7% (Table 1). The average number of catfish eggs per parasitized brood was 9.36±√59.1, as the number of catfish eggs picked up by the red zebra is highly variable. The mean clutch size for parasitized broods was 49 eggs, much larger than non-parasitized broods because catfish eggs are included.
Courtship Observations
The red-zebra courtship study was similar to previous studies done on rock dwelling cichlids (Figure 3). The courtship did not vary from that of the sympatric species (C. horei) nor did it differ from the spawning sequence of the non-sympatric species (P. zebra). The red zebra did, however, show less aggression towards the cuckoo catfish than the sympatric species during courtship.
Developmental Staging
The early developmental stages of the red zebra were divided into the three stages described by Balon (1985), including the cleavage, embryonic, and eleutheroembryonic phase.
Cleavage Phase (day 0 to day 1) (Figure 5a-5e)
Cells divide until they form a blastula (Figure 5a-5c) and the blastula then collapses into the yolk cell (Figure 5d). The Blastodisc is then formed (Figure 5e) followed by the formation of the germ layer (Figure 5f-5g).
Embryonic Phase (day 2 to day 5) See Figure 6a-6d
This phase is outlined by the formation of the head, germ ring, and tail.
Eleutheroembryonic Phase (day 6 to free swimming) See figure 7a-7h
This phase begins with hatching, where the tail becomes detached from the yolk sac, and outlines development until the red zebra fry is free swimming.
In all three stages, the red zebra development did not differ from previous studies of the development of non-sympatric species (albino zebra), nor the sympatric species (C. horei). (A. Cruz and M. Cohen, unpublished data)
Cuckoo Catfish Host Preference
From the general linear model testing of whether or not parasitism could be predicted by brood size or body size, no significant relation was found. The variances of parasitized versus non-parasitized broods were analyzed as dependent on egg number (Figure 8A) versus adult size (Figure 8B). A two-sample Kolmogorov test revealed that these distributions are different in Figure 8B (p <0.05; Table 1). Table 2 shows that the magnitude of the variance of cichlids that were not parasitized is almost double that of the parasitized. There was a significant difference between the variances. This difference was marginally significant (p = 0.05), suggesting that catfish may prefer hosts of an average size (Figure 9).
Discussion
Obligate brood parasitism usually occurs between two specific species that coevolve in the same ecosystem, and not between species in different ecosystems. The cuckoo catfish was thought to only parasitize Lake Tanganyika cichlids (Sato 1986), but the present study, along with unpublished data (A. Cruz and M. Cohen, Cruz lab), demonstrates the cuckoo catfish’s ability to parasitize a cichlid found in Lake Malawi. The naïve host (host and parasite have not come into contact prior to study) in this study is Maylandia estherae (native to the rocky shores of Lake Malawi), which is commonly referred to as the red zebra.
Red Zebra Length and Brood Size
The red zebra clutch size ranged from about 8 to 68 eggs with a range in female body size from about 60 mm to 90 mm. The present study found a significant relation between red zebra brood size and female body size. This may be due in part to the fact that the larger the female, the larger her buccal cavity (which encloses the brood). The significant positive relationship between brood size and cichlid length indicates that older, larger cichlid females are able to carry more eggs and therefore have a higher fecundity. This relation was also found in previous studies (Fawole and Arawomo 2000, Campos-Mendoza et al. 2004, Mannon 2013, Roscow 2012).
Parasitism Avoidance Strategies
Although red-zebra breeding males showed some aggression towards the cuckoo catfish, most aggression was directed at other red zebra males coming into the breeding territory. Over time, there was no significant decrease in parasitism success of the cuckoo catfish. Over the period of this study (about three years) the red zebra did not develop any successful parasitism avoidance strategies. More studies should be done over a longer period of time to further address the question of whether or not the red zebra can develop adaptations to reduce brood parasitism.
Red Zebra Rate of Parasitism and Comparison With Other Host Species
I found that the (not naturally co-occurring) red zebra was parasitized significantly more than (the naturally co-occurring) C. horei used in previous, unpublished studies in the Cruz lab (A. Cruz and M. Cohen). The C. horei is native to Lake Tanganyika, and is naturally parasitized by the cuckoo catfish. It has also presumably coevolved with the cuckoo catfish. The fact that C. horei was parasitized significantly less (Table 1) suggests that the sympatric hold species likely developed adaptations against brood parasitism. This is a novel insight in the current ichthyology (fish) literature, while the use by avian brood parasites of naïve and sympatric hosts has been the subject of several studies. These studies include the study of avian brood parasitism of a naïve host: the village weaver (Ploceus cucullatus) and the shiny cowbird (Molothrus bonariensis) in Hispaniola. Cruz et al. (2004) inferred that, although egg rejection likely has a genetic component, differences in rates of egg rejection between different types of parasitic eggs likely had to do with phenotypic plasticity (ability of an organism to change its phenotype in response to changes in the environment). In areas with more brood parasites, more defenses against brood parasitism may be found. When parasitism avoidance behaviors such as egg rejection have minimal costs, they have also been found to be maintained in avian populations as relic behaviors, even when there are no longer parasites in the population (Rothstein 2001). In this study, both the red zebra and albino zebra showed no new successful adaptations against parasitism, even with parasites present in the population. This is unlike what has been found in avian brood parasitism studies, but should continue to be studied over a longer period of time to see if adaptations are developed. Also, unlike avian brood parasitism (Rothstein 1975, Cruz et al. 2004), there is no egg rejection behavior from the host and no egg mimicry adaptations by the cuckoo catfish.
Parasitism of the Red Zebra vs. Albino Zebra
The question of how eyesight affects the ability of hosts to avoid brood parasitism is poorly understood. For this reason, the albino zebra, an albino morph of the zebra cichlid, a closely related species to the red zebra, and also a rock-dwelling Lake Malawi mbuna species. One of the obvious morphological differences between the red zebra and the albino zebra is that the albino zebra has red eyes, indicating a lack of pigment. Many authors have noted that the lack of pigment in the eyes of albino morphs causes reduced visual acuity (Lashley 1930, Wilson et al. 1988, Abadi and Pascal 1991, Ren et al. 2002). Because visual aspects, including the ability to see color, have been shown to be important in cichlid mating (Seehausen and van Alphen 1998), having reduced visual capabilities could impact the breeding success of a species. Unpublished Cruz lab data (A. Cruz and M. Cohen) show that the albino zebra was parasitized 41% of the time, almost double the rate of parasitism of the red zebra (Table 1). This result leads to the conclusion that eyesight plays a major role in parasitism avoidance.
Early developmental stages of the red zebra
The timing of the early developmental stages of the red zebra coincided with other cichlid studies, including Balon (1985) (Figures 5-7). The timing of the development is important because for mouthbrooding cichlids, the female does not eat while she carries her young. This creates a fitness tradeoff for female fitness and progeny fitness. For species that are parasitized by the cuckoo catfish, developing faster could alter the reproductive success of the cuckoo catfish, since the cuckoo catfish young hatch earlier than their cichlid host and consume the host embryos. The cuckoo catfish young will only eat the cichlid young while they still carry most of their yolk (this is used for sustenance before they leave the mothers mouth), so if the cichlids are able to reach a certain point in their development without being consumed by the catfish young, they will likely survive.
Courtship Observations
The courtship of the red zebra falls in line with the standardized cichlid courtship behavior shown in figure 3. Further studies should be done to investigate how different courtship behaviors affect cuckoo catfish parasitism success, as all the cichlids in this study share similar courtship behaviors.
Cuckoo catfish host preferenceCatfish Host Preference
I found that the cuckoo catfish was successful in parasitizing a naïve host (red zebra) in this study. This posed the question of whether the cuckoo catfish parasitizes hosts at random whenever possible, or whether there are host preferences at play. I found that the cuckoo catfish parasitized red zebras of average size over the largest and smallest in the population. This may be because the smallest breeding red zebras have a smaller buccal cavity and therefore less space for the developing catfish young, as well as fewer red zebra young for the catfish to feed on. The larger the spawning red zebra, the higher the risk of physical harm to the catfish attempting to interrupt the spawning. Cuckoo catfish may therefore prefer an intermediate to maximize buccal cavity space and red zebra young, and to minimize risk of physical harm to the catfish. This also implies that the negative effects of parasitism on brood size are most relevant to female red zebras of average size. This cuckoo catfish host preference is a novel finding that has not been discussed in the literature. More studies should be done to determine why the cuckoo catfish prefers to parasitize cichlids of average size. This also leads to question of what other (if any) host preferences the cuckoo catfish has.
Conclusion
By investigating the interaction between the red zebra, a member of a fish group known for its adaptive capabilities, and a brood parasite, this study gives important insight into whether or not these cichlids adapt in order to increase their reproductive success. Over a period of 3 years, the red zebra seemingly did not develop successful parasitism avoidance strategies against the cuckoo catfish. The catfish however was able to successfully parasitize a host that it had not previously encountered in the wild. The cuckoo catfish was also found in this study to have a size preference for the hosts it parasitized. Although the red zebra was not able to hamper the rate of parasitism among its broods, it was parasitized much less than the albino zebra, suggesting suggestingthat eyesight plays a role in parasitism avoidance. It is important to notice that the albino zebras in the Cruz lab are further removed from the wild than the red zebras, that is, they have been bred in captivity for longer, which could have caused a high rate of parasitism in the albino zebra. Lastly, the red zebra was parasitized significantly more than the species in the lab that coevolved naturally with the catfish. This suggests that sympatric species have adaptations against brood parasitism that the non-sympatric species (red zebra and albino zebra) do not. This may include increased aggression towards the cuckoo catfish. Future studies should be conducted to identify these adaptations to gain further knowledge on adaptations and brood parasitism avoidance.
Acknowledgements
My study was done in the lab of Dr. Alexander Cruz. Resources of Dr. Pamela Diggle were also used. Funding was provided through URAP and UROP grants provided by the University of Colorado at Boulder. Special thanks to Dr. Alexander Cruz and Ph.D. student Marcus Cohen for their support in developing this honors project. Without their guidance this project would not have been possible. I would also like to thank other members of the Cruz lab including Robert Roscow for helping to train me to conduct research in the lab. Lastly, thank you to my committee members Dr. Alexander Cruz, Dr. Barbara Demmig-Adams, and Dr. Holly Barnard for their time and support.
Reference List
- Abadi, Richard V., and Eve Pascal. "Visual Resolution Limits in Human Albinism." Vision Research 31.7-8 (1991): 1445-447.
- Albertson, R. C., Markert, J. A., Danley, P. D. & Kocher, T. D. “Phylogeny of a rapidly evolving clade: The cichlid fishes of Lake Malawi, East Africa.” Proceedings of the National Academy of Science USA 96 (1999): 5107-5110.
- Allender, C. J., Seehausen, O., Knight, M. E., Turner, G. F. & Maclean, N. “Divergent selection during speciation of Lake Malawi cichlid fishes inferred from parallel radiations in nuptial coloration.” Proceedings of the National Academy of Science USA 100 (2003): 14074–14079.
- Amorim, M. C. P., Simões, J. M., Fonseca, P. J., Turner, G. F.. "Species Differences in Courtship Acoustic Signals among Five Lake Malawi Cichlid Species (Pseudotropheus Spp.)." Journal of Fish Biology 72.6 (2008): 1355-368.
- Balon E.K.. “Early ontogeny of Labeotropheus Ahl, 1927 (Mbuna, Cichlidae, Lake Malawi), with a discussion on advanced protective styles in fish reproduction and development.” Environmental Biology of Fishes 2 (1985): 147-176.
- Barlow, G. W.. The Cichlid Fishes: Nature's Grand Experiment in Evolution. Perseus Publishing (2000).
- Campos-Mendoza, A., Mcandrew, B.J., Coward, K., Bromage, N.. "Reproductive Response of Nile Tilapia (Oreochromis Niloticus) to Photoperiodic Manipulation; Effects on Spawning Periodicity, Fecundity and Egg Size." Aquaculture 231.1-4 (2004): 299-314.
- Chichon, M. “The evolution of brood parasitism-the role of facultative parasitism-the role of facultative parasitism.” Behavioral Ecology 7 (1996): 137-139.
- Ciccotto, P. “Descriptions of Five New Species in the Genus Metriaclima (Teleostei: Cichlidae) From Lake Malawi, Africa.” Thesis. The Pennsylvania State University, 2008.
- Cruz A., Prather J. W., Wiley J. W., Weaver P. F. “Egg rejection behavior in a population exposed to parasitism: Village Weavers on Hispaniola.” Behavoral Ecology 19, (2008): 398–403.
- Cruz, A., Knox, J. & Pawlowski, S. “Obligate Brood Parasitism in a freshwater fish, Synodontis multipunctatus, the Cuckoo Catfish.” Encyclopedia of Animal Behavior Greenwood Press (2004): 180-182.
- Economist Intelligence Unit. Malawi-Country Profile 1993/94. Economist Intelligence Unit Limited, London, (1993): 19.
- Fawole, O.O. and Arawomo, G.A.O., “Fecundity of Sarotherodon galilaeus (Pisces: Cichlidae) in the Opa Reservoir, Ile-Ife, Nigeria.” Review of Biology, 48 (2000): 1:1-5.
- Finley, L. “Reproduction in Synodontis multipunctatus Boulnger-An apparent “Cuckoo” relationship with maternal mouthbrooding cichlids.” Freshwater and Marine Aquarium 7 (1984): 22-25, 63, 66-75.
- Fryer, G., Iles, T. D. “The Cichild Fishes of the Great Lakes of Africa: Their Biology and Evolution” Oliver & Boyd, Edinburgh (1972): 641
- Genner M.J., Seehausen O., Lunt D.H., Joyce, D.A., Shaw, P.W., Carvalho, G.R., Turner, G.F. “Age of cichlids: New dates for ancient lake fish radiations.” Molecular Biology and Evolution, 24 (2007): 1269–1282.
- Genner, M. J. & Turner, G. F. “The mbuna cichlids of Lake Malawi: a model for rapid speciation and adaptive radiation.” Fish and Fisheries 6 (2005): 1–34.
- Genner, M.J. & Turner, G.F. “The mbuna cichlids of Lake Malaŵi: A model for rapid speciation and adaptive radiation.” Fish and Fisheries, 6 (2005): 1–34.
- Greenwood, P.H. “African cichlids and evolutionary theories.” Echelle, A.A. & Kornfield, I (Eds.), Evolution of fish species flocks. University of Maine at Orono Press, Orono, Maine, (1984): 141–154.
- Hess, H. C. "Male Mouth Brooding in Jawfishes (Opistognathidae): Constraints On Polygyny." Bulletin of Marine Science 52.2 (1993): 806-818.
- Joyce, D.A., Lunt, D.H., Genner, M.J., Turner, G.F., Bilos, R., Seehausen, O. “Repeated colonization and hybridization in Lake Malawi cichlids.” Current Biology, 21 (2011): 108–109.
- Kidd, M.R., Danley, P.D., Kocher, T.D. “A direct assay of female choice in cichlids: all the eggs in one basket.” Journal of Fish Biology, 68 (2006): 373–384.
- Knight, M.E., Turner, G.F. “Laboratory mating trials indicate incipient speciation by sexual selection among populations of the cichlid fish Pseudotropheus Maylandia zebra from Lake Malawi.” Proceedings of the Royal Society B. 271 (2004): 675 – 680.
- Kocher T.D., Conroy J.A., McKaye K.R., Stauffer J.R. “Similar morphologies of cichlid fish in Lakes Tanganyika and Malawi are due to convergence.” Molecular Phylogenetics and Evolution, 2 (1993): 158–165.
- Konings, A. Cichlids and all the other fishes of Lake Malawi. T.F.H. Publications, Inc., Neptune City, New Jersey (1990).
- Konings, A. Tanganyika Cichlids in Their Natural Habitat. Zevenhuizen, Netherlands: Cichlid, (1998).
- Konings A. Malawi Cichlids in Their Natural Habitat. 3rd edition. Cichlid Press, El Paso, Texas, USA (2001).
- Konings, A. Malaŵi cichlids in their natural habitat. Fourth edition. Cichlid Press, El Paso, Texas, (2007): 424.
- Kuwamura, T. "Parental Care and Mating Systems of Cichlid Fishes in Lake Tanganyika: A Preliminary Field Survey." Journal of Ethology 4.2 (1986): 129-46.
- Lashley, K. S. "The Mechanism of Vision: III. The Comparative Visual Acuity of Pigmented and Albino Rats." The Pedagogical Seminary and Journal of Genetic Psychology 37.4 (1930): 481-84.
- Levine, J.S., MacNichol, E.F. “Visual pigments in teleost fishes: effects of habitat, microhabitat, and behavior on visual system evolution.” Sensory Processes, 3 (1979): 95–131
- Lowe-Mcconnell, R. H. "Recent Research in the African Great Lakes: Fisheries, Biodiversity and Cichlid Evolution ." Freshwater Forum, 20. (2003): 4-64.
- Lowe-Mcconnell, R. H. "Fish Faunas of the African Great Lakes: Origins, Diversity, and Vulnerability." Conservation Biology 7.3 (1993): 634-43.
- Mannon, Makenzie J. "Behavioral and Early Developmental Biology of a Mouthbrooding Malaŵian Cichlid, Melanochromis Johanni." Thesis. University of Colorado at Boulder, (2013).
- Meyer, A., T. D. Kocher, P. Basasibwaki, and A. C. Wilson. "Monophyletic Origin of Lake Victoria Cichlid Fishes Suggested by Mitochondrial DNA Sequences." Nature 347.6293 (1990): 550-53.
- Moran, P., Kornfield, I., Reinthal, P.N. “Molecular systematics and radiation of the haplochromine cichlids (Teleostei, Perciformes) of Lake Malawi.” Copeia, 2 (1994): 274–288.
- Muller, G., Forstner, U.. "Recent Iron Ore Formation in Lake Malawi, Africa." Mineralium Deposita 8.3 (1973): n. pag.
- Ochi, H. “Mate monopolization by a dominant male in a multi-male social group of a mouthbrooding cichlid, Ctenochromis horei.” Japanese Journal of Ichthyology, 40 (1993): 209–218
- Plumptre, A., Davenport, T., Behangana, M., Kityo, R., Eilu, G., Ssegawa, P., Ewango, C., Meirte, D., Kahindo, C., Herremans, M. "The Biodiversity of the Albertine Rift." Biological Conservation 134.2 (2007): 178-94.
- Reichard, M., C. Smith, and J. Bryja. "Seasonal Change in the Opportunity for Sexual Selection." Molecular Ecology 17.2 (2008): 642-51.
- Ren, J. Q., Mccarthy, W.R., Zhang, H., Adolph, A.R., Lei, L. "Behavioral Visual Responses of Wild-type and Hypopigmented Zebrafish." Vision Research 42.3 (2002): 293-99.
- Richter, H. Complete Book of Dwarf Cichlids. Neptune City, N.J. (One T.F.H. Plaza, Neptune City 07753): T.F.H., (1989).
- Roberts, E. M., Stevens, N. J., O’Connor, P. M., Dirks, G.M., Gottfried, M.D., Clyde, W. C., Armstrong, R. A., Kemp, A. I. S., Hemming, S. "Initiation of the Western Branch of the East African Rift Coeval with the Eastern Branch." Nature Geoscience 5.4 (2012): 289-94.
- Roscow, Robert F. "Brood Parasitism and Early Growth Rates of African Rift Lake Cichlids." Thesis. University of Colorado at Boulder, 2012.
- Rothstein, S. I. "An Experimental and Teleonomic Investigation of Avian Brood Parasitism." The Condor 77.3 (1975): 250-71.
- Rothstein, S.I. “A model system for coevolution: avian brood parasitism.” Annual Review of Ecology and Systematics, 21 (1990): 481-508.
- Rothstein, S. I. "Relic Behaviours, Coevolution and the Retention versus Loss of Host Defenses after Episodes of Avian Brood Parasitism." Animal Behaviour 61.1 (2001): 95-107.
- Sato, T. A “Brood parasitic catfish of mouthbrooding cichlid fishes in Lake Tanganyika.” Nature, 323 (1986): 58-59 .
- Seehausen, O.,Van Alphen, J.J.M “The effect of male coloration on female mate choice in closely related Lake Victoria cichlids (Haplochromis nyererei complex).” Behavioral Ecology and Sociobiology, 42 (1998): 1–8
- Seehausen, O. "Keeping and Breeding Rock-dwelling Cichlids." Lake Victoria Rock Cichlids: Taxonomy, Ecology, and Distribution. Zvenhuizen, the Netherlands: Verduyn Cichlids, (1996): 45-57.
- Sefc, K. M., C. M. Hermann, and S. Koblmüller. "Mating System Variability in a Mouthbrooding Cichlid Fish from a Tropical Lake." Molecular Ecology 18.16 (2009): 3508-517.
- Soler, J.J., Soler, M., “Brood-parasite interactions between great spotted cuckoos and magpies: a model system for studying coevolutionary relationships.” Oecologia, 125 (2000): 309-320
- Stauffer J., J.R., Bowers, N.J., Kellogg, K.A., McKaye, K.R. “A Revision of the Blue-Black Pseudotropheus zebra (Teleostei: Cichlidae) Complex from Lake Malaŵi, Africa, with a Description of a New Genus and Ten New Species.” Academy of Natural Sciences, 148 (1997): 189-230
- Stauffer, J. R., Black, K., Konings, A. F., "Descriptions of Five New Species of Metriaclima (Teleostei: Cichlidae) from Lake Malaŵi, Africa." Zootaxa 3647.1 (2013): 101-36.
- Sturmbauer, C., A. Meyer. "Genetic Divergence, Speciation and Morphological Stasis in a Lineage of African Cichlid Fishes." Nature 358.6387 (1992): 578-81.
- Sturmbauer, C. “Explosive speciation in cichlid fishes of the African Great Lakes: a dynamic model of adaptive radiation.” Journal of Fish Biology, 53 (1998): 18–36.
- Sturmbauer, C., S. Baric, W. Salzburger, L. Ruber, and E. Verheyen. "Lake Level Fluctuations Synchronize Genetic Divergences of Cichlid Fishes in African Lakes." Molecular Biology and Evolution 18.2 (2001): 144-54.
- Taborsky, B., and K. Foerster. "Female Mouthbrooders Adjust Incubation Duration to Perceived Risk of Predation." Animal Behaviour 68.6 (2004): 1275-281.
- Tkint, T., Verheyen, E., De Kegel, B., Helsen, P., Adriaens, D. "Dealing with Food and Eggs in Mouthbrooding Cichlids: Structural and Functional Trade-Offs in Fitness Related Traits." PLoS ONE 7.2 (2012): n. pag.
- Verheyen, E., L. Ruber, J. Snoeks, and A. Meyer. "Mitochondrial Phylogeography of Rock-Dwelling Cichlid Fishes Reveals Evolutionary Influence of Historical Lake Level Fluctuations of Lake Tanganyika, Africa." Philosophical Transactions of the Royal Society B: Biological Sciences 351.1341 (1996): 797-805.
- Wahlsten, D. “Genetic experiments with animal learning: A critical review.” Behavioral Biology 7 (1972): 143-182.
- Wilson, H. R., Mets, M. B., Nagy, S. E., Kressel, A. B. "Albino Spatial Vision as an Instance of Arrested Visual Development." Vision Research 28.9 (1988): 979-90.
Figures and Tables
Figure 1: East African Great Lakes: Lake Victoria, Lake Tanganyika, and Lake Malawi (from Nyamweru C.K. 1983)

Figure 2: Lake Malawi (Owen, et. al. 1990)

Figure 3: Cichlid Courtship sequence based on (Seehausen 1996)
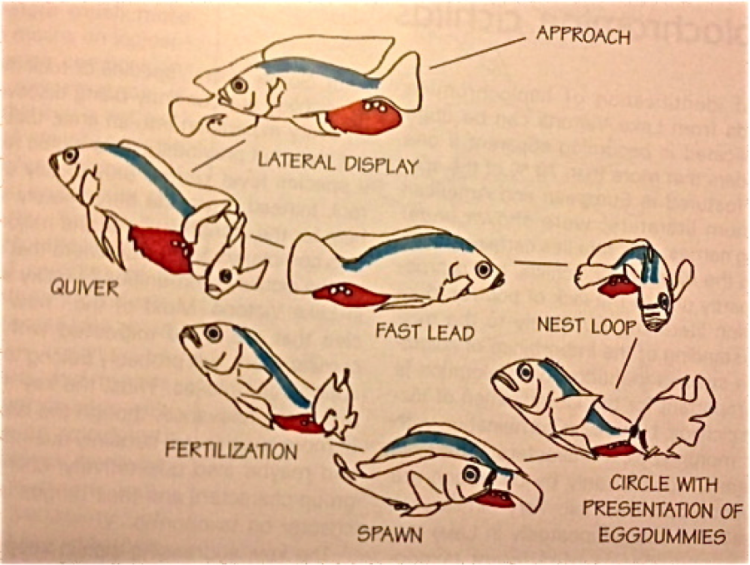
Table 1. Frequency of parasitism for three species of African mouthbrooding cichlids. Lakes of origin are denoted in parentheses. Allopatric parasitism frequencies are significantly higher for allopatric species (p< 0.001 for the red zebra and the albino zebra).
|
|
C. horei (Tanganyika) |
Red zebra M. estherae (Malawi) |
Albino zebra M. zebra (Malawi) |
|
Parasitized |
17 |
35 |
92 |
|
Unparasitized |
86 |
101 |
133 |
|
% Parasitism |
16.5% |
25.7% |
40.9% |
Figure 4: Relationship between cichlid brood size and body size, p < 0.01 and r = 0.46.

Figure 5a-e: Cleavage Phase Day 0 of Maylandia estherae (red zebra cichlid).


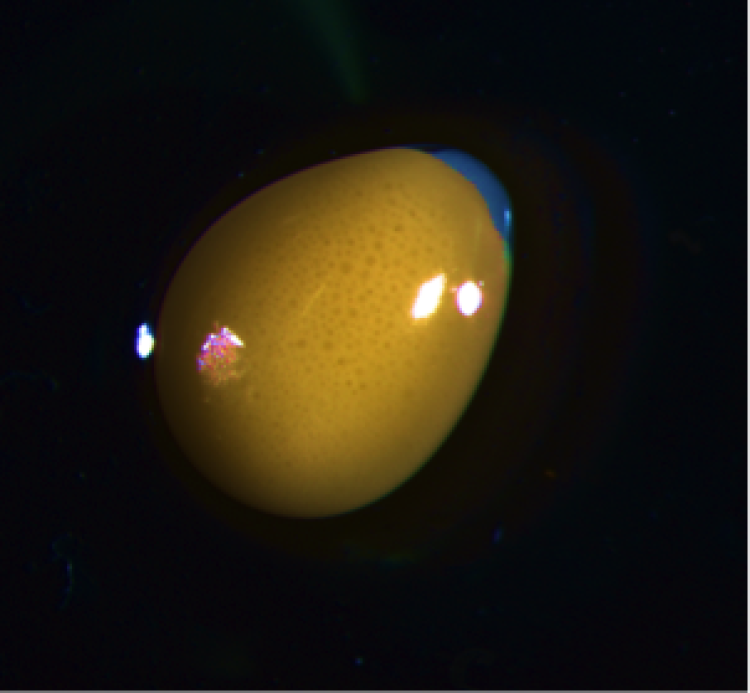
Figure 5f-g Cleavage Phase Day 1 of Maylandia estherae (red zebra cichlid).


Figure 6 a-d: Embryonic Phase of Maylandia estherae (red zebra).


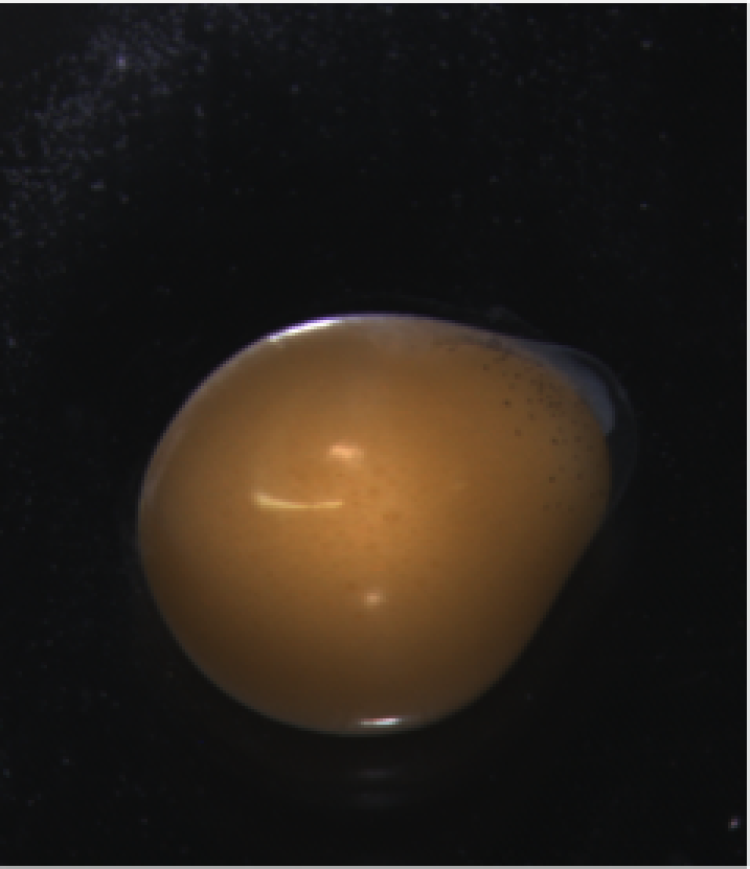
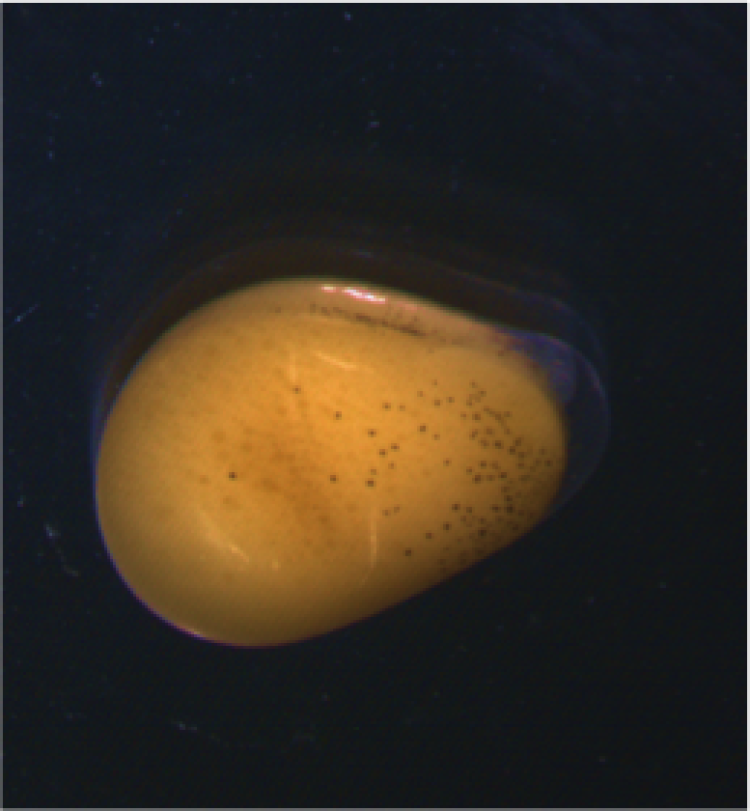
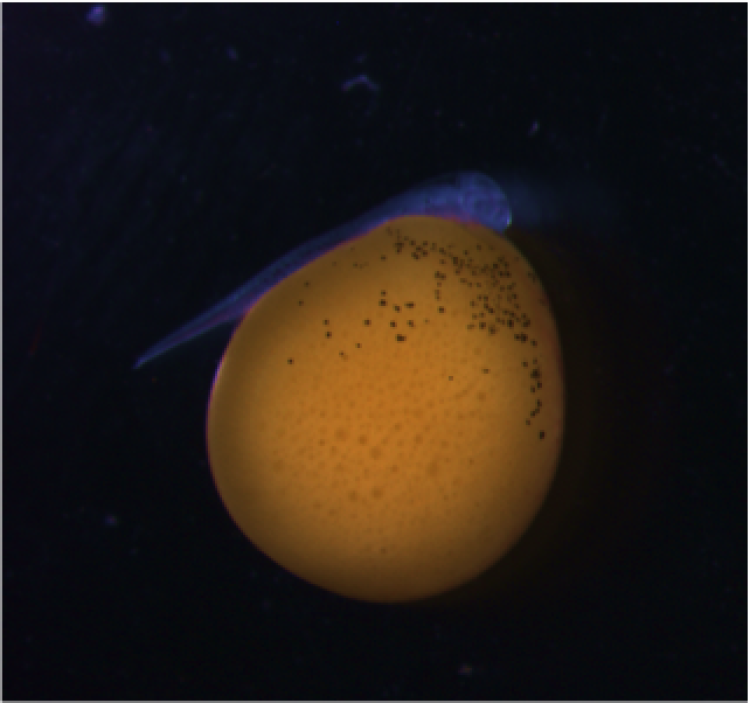
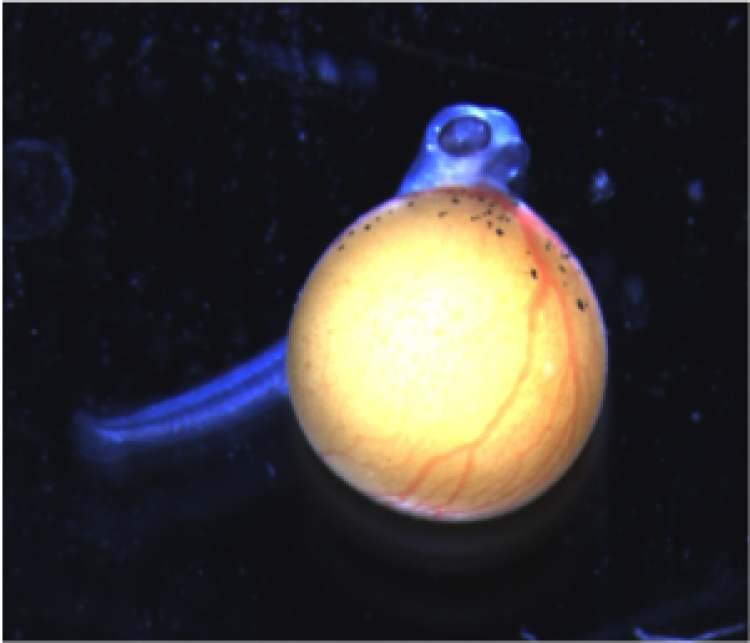


Figure 7a-h: Eleutheroembryonic Phase (post hatching) of Maylandia estherae (red zebra)
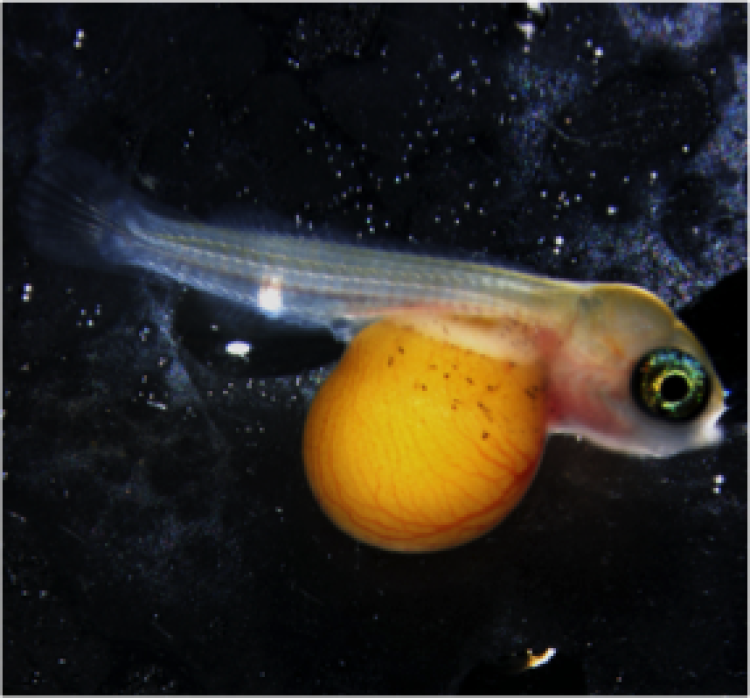
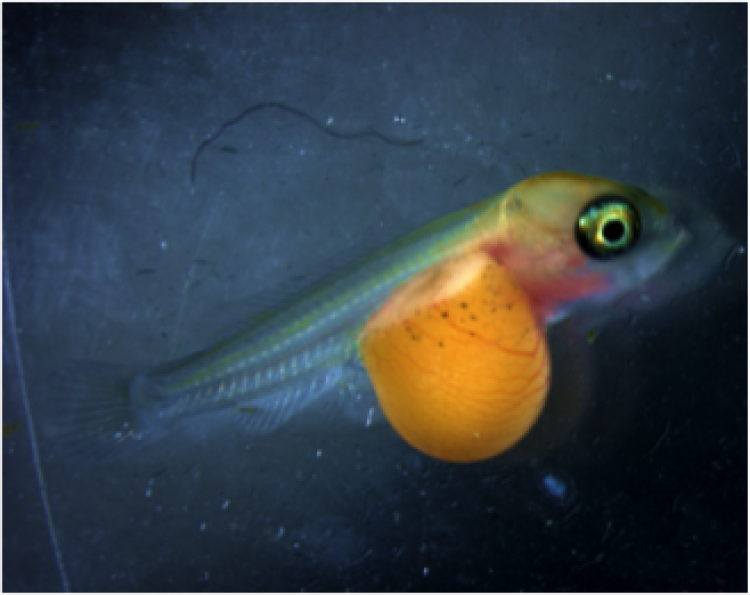

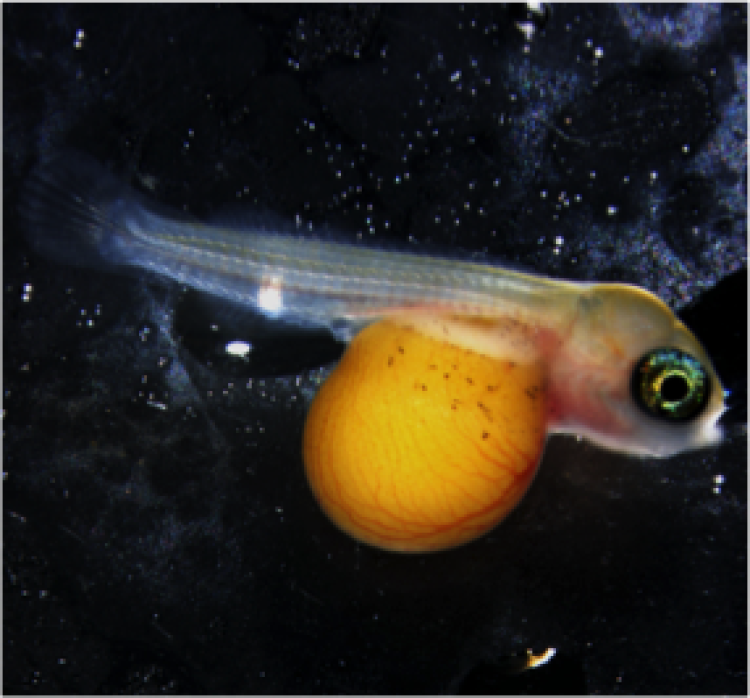


Figure 7 Continued
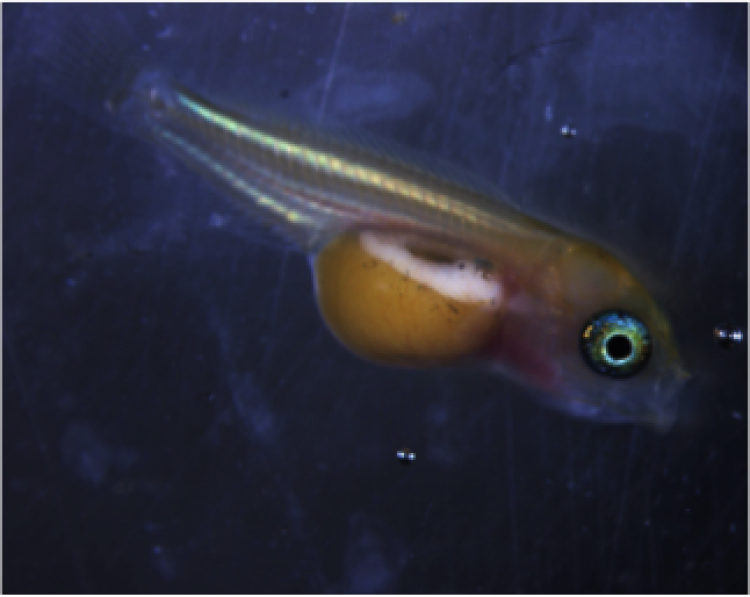


Figure 8A and 8B. The distribution of the sizes of cichlids that were parasitized versus the distribution of the sizes of cichlids that were not parasitized. Figure 5A shows that there is no difference in distribution of number of cichlid eggs in broods that are and are not parasitized. Figure 5B shows that there is a difference in distribution between the lengths of parasitized cichlids compared to unparasitized cichlids.
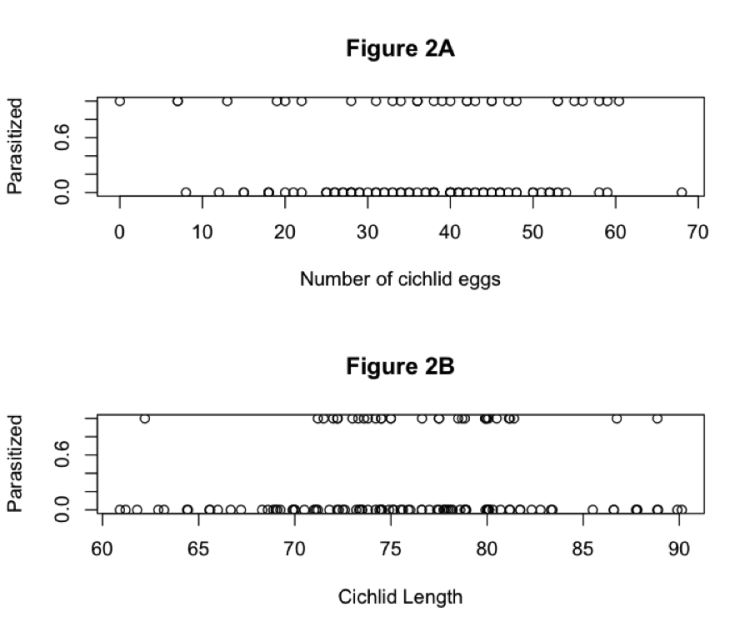
Table 2: Significant difference of variances of host size(p < .05).
|
Differing Variances of Parasitized vs. Non- Parasitized Cichlids |
Parasitized |
Not Parasitized |
|
Variance of Cichlid Size |
25.86 |
47.03 |
Figure 9: Significant difference in distributions between non-parasitized and parasitized cichlids (p<0.05)
Non-parasitized vs. Parasitized Cichlid Length
Non-parasitized vs. Parasitized Cichlid Length
