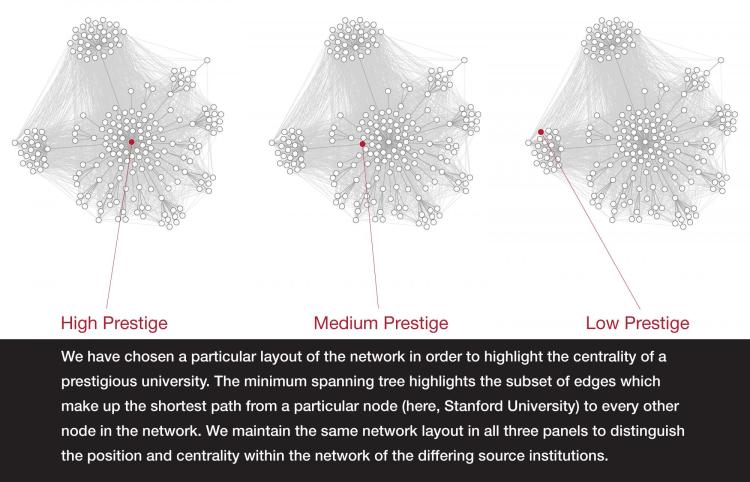
The Data Visualization Contest seeks to increase awareness of the powerful insights that come from the process of visualizing data. Creating a visualization is a time to engage, reflect, and learn deeply from the story the data tells. This year's exhibit features the work of McKenzie Mae Weller, Computer Science undergraduate for her project “Simulated Adoption Of Research Ideas Originating From Different Universities;” Julia Uhr, Ph.D. candidate in Philosophy, for “Modeling Polygamous Marriage Markets;” and Elysia Salvo Lucas, senior in Applied Math, for “Magnetic Field Draping At Venus.”
Accompanying each visualization are statements by the authors describing how they made their visualizations and what they learned about their data from the process. The Data Visualization Contest exhibit will remain on display outside CRDDS room 206 through 2019. To learn more about the individual winners, check out our February story.

